A Look At The Fair Value Of Thong Guan Industries Berhad (KLSE:TGUAN)
Key Insights
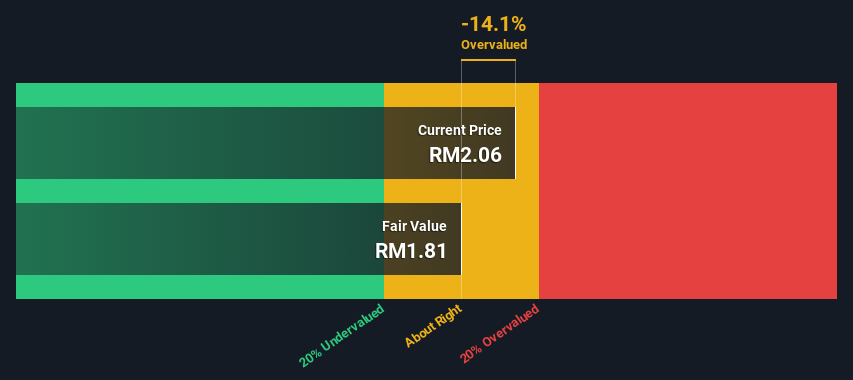
The projected fair value for Thong Guan Industries Berhad is RM1.81 based on 2 Stage Free Cash Flow to Equity
Thong Guan Industries Berhad's RM2.06 share price indicates it is trading at similar levels as its fair value estimate
When compared to theindustry average discount of -55%, Thong Guan Industries Berhad's competitors seem to be trading at a greater premium to fair value
How far off is Thong Guan Industries Berhad (KLSE:TGUAN) from its intrinsic value? Using the most recent financial data, we'll take a look at whether the stock is fairly priced by projecting its future cash flows and then discounting them to today's value. We will take advantage of the Discounted Cash Flow (DCF) model for this purpose. Models like these may appear beyond the comprehension of a lay person, but they're fairly easy to follow.
We would caution that there are many ways of valuing a company and, like the DCF, each technique has advantages and disadvantages in certain scenarios. For those who are keen learners of equity analysis, the Simply Wall St analysis model here may be something of interest to you.
Check out our latest analysis for Thong Guan Industries Berhad
Step By Step Through The Calculation
We're using the 2-stage growth model, which simply means we take in account two stages of company's growth. In the initial period the company may have a higher growth rate and the second stage is usually assumed to have a stable growth rate. To start off with, we need to estimate the next ten years of cash flows. Where possible we use analyst estimates, but when these aren't available we extrapolate the previous free cash flow (FCF) from the last estimate or reported value. We assume companies with shrinking free cash flow will slow their rate of shrinkage, and that companies with growing free cash flow will see their growth rate slow, over this period. We do this to reflect that growth tends to slow more in the early years than it does in later years.
A DCF is all about the idea that a dollar in the future is less valuable than a dollar today, and so the sum of these future cash flows is then discounted to today's value:
10-year free cash flow (FCF) forecast
2024 | 2025 | 2026 | 2027 | 2028 | 2029 | 2030 | 2031 | 2032 | 2033 | |
Levered FCF (MYR, Millions) | RM53.2m | RM53.0m | RM53.4m | RM54.3m | RM55.5m | RM57.0m | RM58.7m | RM60.5m | RM62.4m | RM64.5m |
Growth Rate Estimate Source | Analyst x1 | Analyst x1 | Est @ 0.83% | Est @ 1.65% | Est @ 2.23% | Est @ 2.63% | Est @ 2.91% | Est @ 3.11% | Est @ 3.25% | Est @ 3.34% |
Present Value (MYR, Millions) Discounted @ 10% | RM48.2 | RM43.5 | RM39.8 | RM36.7 | RM34.0 | RM31.6 | RM29.5 | RM27.5 | RM25.8 | RM24.1 |
("Est" = FCF growth rate estimated by Simply Wall St)
Present Value of 10-year Cash Flow (PVCF) = RM341m
The second stage is also known as Terminal Value, this is the business's cash flow after the first stage. The Gordon Growth formula is used to calculate Terminal Value at a future annual growth rate equal to the 5-year average of the 10-year government bond yield of 3.6%. We discount the terminal cash flows to today's value at a cost of equity of 10%.
Terminal Value (TV)= FCF2033 × (1 + g) ÷ (r – g) = RM65m× (1 + 3.6%) ÷ (10%– 3.6%) = RM988m
Present Value of Terminal Value (PVTV)= TV / (1 + r)10= RM988m÷ ( 1 + 10%)10= RM369m
The total value, or equity value, is then the sum of the present value of the future cash flows, which in this case is RM710m. To get the intrinsic value per share, we divide this by the total number of shares outstanding. Relative to the current share price of RM2.1, the company appears around fair value at the time of writing. The assumptions in any calculation have a big impact on the valuation, so it is better to view this as a rough estimate, not precise down to the last cent.
Important Assumptions
Now the most important inputs to a discounted cash flow are the discount rate, and of course, the actual cash flows. Part of investing is coming up with your own evaluation of a company's future performance, so try the calculation yourself and check your own assumptions. The DCF also does not consider the possible cyclicality of an industry, or a company's future capital requirements, so it does not give a full picture of a company's potential performance. Given that we are looking at Thong Guan Industries Berhad as potential shareholders, the cost of equity is used as the discount rate, rather than the cost of capital (or weighted average cost of capital, WACC) which accounts for debt. In this calculation we've used 10%, which is based on a levered beta of 0.845. Beta is a measure of a stock's volatility, compared to the market as a whole. We get our beta from the industry average beta of globally comparable companies, with an imposed limit between 0.8 and 2.0, which is a reasonable range for a stable business.
SWOT Analysis for Thong Guan Industries Berhad
Strength
Debt is not viewed as a risk.
Dividends are covered by earnings and cash flows.
Weakness
Earnings declined over the past year.
Dividend is low compared to the top 25% of dividend payers in the Packaging market.
Opportunity
Annual earnings are forecast to grow faster than the Malaysian market.
Good value based on P/E ratio compared to estimated Fair P/E ratio.
Threat
No apparent threats visible for TGUAN.
Moving On:
Whilst important, the DCF calculation ideally won't be the sole piece of analysis you scrutinize for a company. It's not possible to obtain a foolproof valuation with a DCF model. Instead the best use for a DCF model is to test certain assumptions and theories to see if they would lead to the company being undervalued or overvalued. If a company grows at a different rate, or if its cost of equity or risk free rate changes sharply, the output can look very different. For Thong Guan Industries Berhad, we've put together three important elements you should further examine:
Risks: You should be aware of the 1 warning sign for Thong Guan Industries Berhad we've uncovered before considering an investment in the company.
Future Earnings: How does TGUAN's growth rate compare to its peers and the wider market? Dig deeper into the analyst consensus number for the upcoming years by interacting with our free analyst growth expectation chart.
Other Solid Businesses: Low debt, high returns on equity and good past performance are fundamental to a strong business. Why not explore our interactive list of stocks with solid business fundamentals to see if there are other companies you may not have considered!
PS. Simply Wall St updates its DCF calculation for every Malaysian stock every day, so if you want to find the intrinsic value of any other stock just search here.
Have feedback on this article? Concerned about the content? Get in touch with us directly. Alternatively, email editorial-team (at) simplywallst.com.
This article by Simply Wall St is general in nature. We provide commentary based on historical data and analyst forecasts only using an unbiased methodology and our articles are not intended to be financial advice. It does not constitute a recommendation to buy or sell any stock, and does not take account of your objectives, or your financial situation. We aim to bring you long-term focused analysis driven by fundamental data. Note that our analysis may not factor in the latest price-sensitive company announcements or qualitative material. Simply Wall St has no position in any stocks mentioned.
