Excel Force MSC Berhad (KLSE:EFORCE) Stock's Been Sliding But Fundamentals Look Decent: Will The Market Correct The Share Price In The Future?
With its stock down 18% over the past week, it is easy to disregard Excel Force MSC Berhad (KLSE:EFORCE). However, the company's fundamentals look pretty decent, and long-term financials are usually aligned with future market price movements. Particularly, we will be paying attention to Excel Force MSC Berhad's ROE today.
Return on Equity or ROE is a test of how effectively a company is growing its value and managing investors’ money. In other words, it is a profitability ratio which measures the rate of return on the capital provided by the company's shareholders.
See our latest analysis for Excel Force MSC Berhad
How Do You Calculate Return On Equity?
ROE can be calculated by using the formula:
Return on Equity = Net Profit (from continuing operations) ÷ Shareholders' Equity
So, based on the above formula, the ROE for Excel Force MSC Berhad is:
8.0% = RM8.6m ÷ RM107m (Based on the trailing twelve months to December 2022).
The 'return' is the yearly profit. So, this means that for every MYR1 of its shareholder's investments, the company generates a profit of MYR0.08.
What Is The Relationship Between ROE And Earnings Growth?
We have already established that ROE serves as an efficient profit-generating gauge for a company's future earnings. Based on how much of its profits the company chooses to reinvest or "retain", we are then able to evaluate a company's future ability to generate profits. Assuming all else is equal, companies that have both a higher return on equity and higher profit retention are usually the ones that have a higher growth rate when compared to companies that don't have the same features.
Excel Force MSC Berhad's Earnings Growth And 8.0% ROE
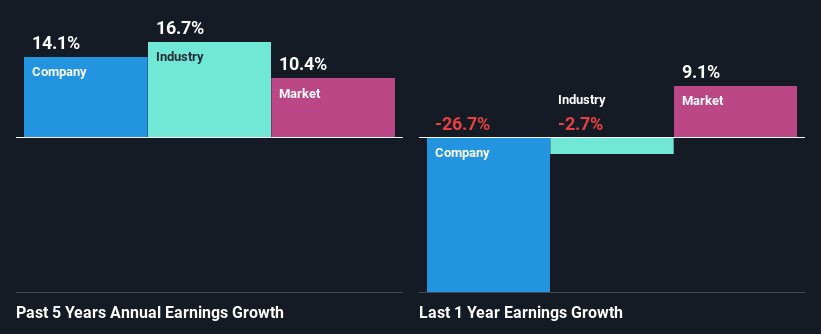
At first glance, Excel Force MSC Berhad's ROE doesn't look very promising. However, its ROE is similar to the industry average of 8.6%, so we won't completely dismiss the company. On the other hand, Excel Force MSC Berhad reported a moderate 14% net income growth over the past five years. Taking into consideration that the ROE is not particularly high, we reckon that there could also be other factors at play which could be influencing the company's growth. For example, it is possible that the company's management has made some good strategic decisions, or that the company has a low payout ratio.
We then performed a comparison between Excel Force MSC Berhad's net income growth with the industry, which revealed that the company's growth is similar to the average industry growth of 17% in the same 5-year period.
The basis for attaching value to a company is, to a great extent, tied to its earnings growth. It’s important for an investor to know whether the market has priced in the company's expected earnings growth (or decline). Doing so will help them establish if the stock's future looks promising or ominous. Is Excel Force MSC Berhad fairly valued compared to other companies? These 3 valuation measures might help you decide.
Is Excel Force MSC Berhad Efficiently Re-investing Its Profits?
Excel Force MSC Berhad has a significant three-year median payout ratio of 67%, meaning that it is left with only 33% to reinvest into its business. This implies that the company has been able to achieve decent earnings growth despite returning most of its profits to shareholders.
Additionally, Excel Force MSC Berhad has paid dividends over a period of at least ten years which means that the company is pretty serious about sharing its profits with shareholders.
Summary
Overall, we feel that Excel Force MSC Berhad certainly does have some positive factors to consider. That is, quite an impressive growth in earnings. However, the low profit retention means that the company's earnings growth could have been higher, had it been reinvesting a higher portion of its profits. Until now, we have only just grazed the surface of the company's past performance by looking at the company's fundamentals. You can do your own research on Excel Force MSC Berhad and see how it has performed in the past by looking at this FREE detailed graph of past earnings, revenue and cash flows.
Have feedback on this article? Concerned about the content? Get in touch with us directly. Alternatively, email editorial-team (at) simplywallst.com.
This article by Simply Wall St is general in nature. We provide commentary based on historical data and analyst forecasts only using an unbiased methodology and our articles are not intended to be financial advice. It does not constitute a recommendation to buy or sell any stock, and does not take account of your objectives, or your financial situation. We aim to bring you long-term focused analysis driven by fundamental data. Note that our analysis may not factor in the latest price-sensitive company announcements or qualitative material. Simply Wall St has no position in any stocks mentioned.
Join A Paid User Research Session
You’ll receive a US$30 Amazon Gift card for 1 hour of your time while helping us build better investing tools for the individual investors like yourself. Sign up here
