
An Intrinsic Calculation For Hutchison Port Holdings Trust (SGX:NS8U) Suggests It's 46% Undervalued
An Intrinsic Calculation For Hutchison Port Holdings Trust (SGX:NS8U) Suggests It's 46% Undervalued
Key Insights
關鍵見解
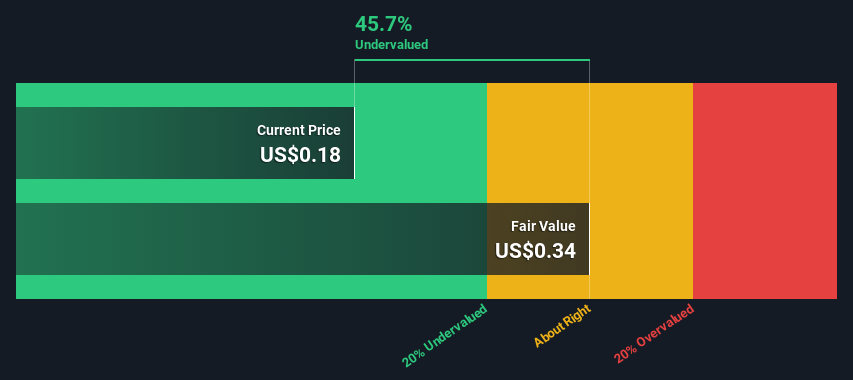
- The projected fair value for Hutchison Port Holdings Trust is US$0.34 based on 2 Stage Free Cash Flow to Equity
- Current share price of US$0.18 suggests Hutchison Port Holdings Trust is potentially 46% undervalued
- Analyst price target for NS8U is HK$0.21 which is 38% below our fair value estimate
- 根據兩階段股權自由現金流計算,和記港口控股信託的預計公允價值爲0.34美元
- 目前0.18美元的股價表明和記港口控股信託基金的估值可能被低估了46%
- NS8U的分析師目標股價爲0.21港元,比我們的公允價值估計值低38%
Today we'll do a simple run through of a valuation method used to estimate the attractiveness of Hutchison Port Holdings Trust (SGX:NS8U) as an investment opportunity by taking the forecast future cash flows of the company and discounting them back to today's value. Our analysis will employ the Discounted Cash Flow (DCF) model. It may sound complicated, but actually it is quite simple!
今天,我們將簡單介紹一種估值方法,該方法用於估算和記港口控股信託(SGX: NS8U)作爲投資機會的吸引力,方法是利用公司的未來現金流預測並將其折扣回今天的價值。我們的分析將採用貼現現金流 (DCF) 模型。聽起來可能很複雜,但實際上很簡單!
We would caution that there are many ways of valuing a company and, like the DCF, each technique has advantages and disadvantages in certain scenarios. Anyone interested in learning a bit more about intrinsic value should have a read of the Simply Wall St analysis model.
我們要提醒的是,對公司進行估值的方法有很多,就像DCF一樣,每種技術在某些情況下都有優點和缺點。任何有興趣進一步了解內在價值的人都應該讀一讀 Simply Wall St 分析模型。
View our latest analysis for Hutchison Port Holdings Trust
查看我們對和記港口控股信託的最新分析
Step By Step Through The Calculation
逐步進行計算
We are going to use a two-stage DCF model, which, as the name states, takes into account two stages of growth. The first stage is generally a higher growth period which levels off heading towards the terminal value, captured in the second 'steady growth' period. To start off with, we need to estimate the next ten years of cash flows. Seeing as no analyst estimates of free cash flow are available to us, we have extrapolate the previous free cash flow (FCF) from the company's last reported value. We assume companies with shrinking free cash flow will slow their rate of shrinkage, and that companies with growing free cash flow will see their growth rate slow, over this period. We do this to reflect that growth tends to slow more in the early years than it does in later years.
我們將使用兩階段的DCF模型,顧名思義,該模型考慮了兩個增長階段。第一階段通常是較高的增長期,在第二個 “穩步增長” 時期逐漸趨於平穩,最終值是第二個 “穩定增長” 時期。首先,我們需要估計未來十年的現金流。鑑於我們沒有分析師對自由現金流的估計,我們從公司上次公佈的價值中推斷了之前的自由現金流(FCF)。我們假設自由現金流萎縮的公司將減緩其萎縮速度,而自由現金流不斷增長的公司在此期間的增長率將放緩。我們這樣做是爲了反映早期增長的放緩幅度往往比後來的幾年更大。
A DCF is all about the idea that a dollar in the future is less valuable than a dollar today, so we discount the value of these future cash flows to their estimated value in today's dollars:
差價合約就是關於未來一美元的價值低於今天一美元的概念,因此我們將這些未來現金流的價值折現爲以今天的美元計算的估計價值:
10-year free cash flow (FCF) estimate
10 年自由現金流 (FCF) 估計
| 2024 | 2025 | 2026 | 2027 | 2028 | 2029 | 2030 | 2031 | 2032 | 2033 | |
| Levered FCF (HK$, Millions) | HK$3.55b | HK$3.23b | HK$3.05b | HK$2.95b | HK$2.89b | HK$2.88b | HK$2.88b | HK$2.90b | HK$2.93b | HK$2.97b |
| Growth Rate Estimate Source | Est @ -13.65% | Est @ -8.96% | Est @ -5.69% | Est @ -3.39% | Est @ -1.79% | Est @ -0.66% | Est @ 0.12% | Est @ 0.67% | Est @ 1.06% | Est @ 1.33% |
| Present Value (HK$, Millions) Discounted @ 14% | HK$3.1k | HK$2.5k | HK$2.1k | HK$1.8k | HK$1.5k | HK$1.3k | HK$1.2k | HK$1.0k | HK$912 | HK$812 |
| 2024 | 2025 | 2026 | 2027 | 2028 | 2029 | 2030 | 2031 | 2032 | 2033 | |
| 槓桿FCF(港元,百萬元) | 35.5 億港元 | 32.3 億港元 | 30.5 億港元 | 29.5億港元 | 28.9億港元 | 28.8 億港元 | 28.8 億港元 | 29.0 億港元 | 29.3億港元 | 29.7 億港元 |
| 增長率估算來源 | 美國東部標準時間 @ -13.65% | 美國東部標準時間 @ -8.96% | 美國東部標準時間 @ -5.69% | 美國東部標準時間 @ -3.39% | 美國東部標準時間 @ -1.79% | Est @ -0.66% | Est @ 0.12% | Est @ 0.67% | 美國東部時間 @ 1.06% | 美國東部標準時間 @ 1.33% |
| 現值(港元,百萬元)折扣@ 14% | 3.1 萬港元 | 2.5 萬港元 | 210 萬港元 | 1.8萬港元 | 1.5 萬港元 | 130 萬港元 | 120 萬港元 | 1.0 萬港元 | 912 港元 | 812 港元 |
("Est" = FCF growth rate estimated by Simply Wall St)
Present Value of 10-year Cash Flow (PVCF) = HK$16b
(“Est” = Simply Wall St估計的FCF增長率)
10年期現金流(PVCF)的現值 = 160 億港元
After calculating the present value of future cash flows in the initial 10-year period, we need to calculate the Terminal Value, which accounts for all future cash flows beyond the first stage. For a number of reasons a very conservative growth rate is used that cannot exceed that of a country's GDP growth. In this case we have used the 5-year average of the 10-year government bond yield (2.0%) to estimate future growth. In the same way as with the 10-year 'growth' period, we discount future cash flows to today's value, using a cost of equity of 14%.
在計算了最初10年期未來現金流的現值之後,我們需要計算終端價值,該終端價值考慮了第一階段之後的所有未來現金流。出於多種原因,使用了非常保守的增長率,不能超過一個國家的GDP增長率。在本例中,我們使用了10年期政府債券收益率的5年平均值(2.0%)來估計未來的增長。與10年 “增長” 期一樣,我們使用14%的權益成本將未來的現金流折現爲今天的價值。
Terminal Value (TV)= FCF2033 × (1 + g) ÷ (r – g) = HK$3.0b× (1 + 2.0%) ÷ (14%– 2.0%) = HK$25b
終端價值 (TV)= FCF2033 × (1 + g) ⇒ (r — g) = 30億港元× (1 + 2.0%) ⇒ (14% — 2.0%) = 250億港元
Present Value of Terminal Value (PVTV)= TV / (1 + r)10= HK$25b÷ ( 1 + 14%)10= HK$7.0b
終端價值的現值 (PVTV)= 電視/ (1 + r)10= 250億港元⇒ (1 + 14%)10= 70 億港元
The total value, or equity value, is then the sum of the present value of the future cash flows, which in this case is HK$23b. In the final step we divide the equity value by the number of shares outstanding. Compared to the current share price of US$0.2, the company appears quite good value at a 46% discount to where the stock price trades currently. Valuations are imprecise instruments though, rather like a telescope - move a few degrees and end up in a different galaxy. Do keep this in mind.
因此,總價值或權益價值就是未來現金流現值的總和,在本例中爲230億港元。在最後一步中,我們將權益價值除以已發行股票的數量。與目前的0.2美元股價相比,該公司看起來物有所值,比目前的股價折扣了46%。但是,估值是不精確的儀器,就像望遠鏡一樣,移動幾度然後進入另一個星系。一定要記住這一點。
The Assumptions
假設
We would point out that the most important inputs to a discounted cash flow are the discount rate and of course the actual cash flows. If you don't agree with these result, have a go at the calculation yourself and play with the assumptions. The DCF also does not consider the possible cyclicality of an industry, or a company's future capital requirements, so it does not give a full picture of a company's potential performance. Given that we are looking at Hutchison Port Holdings Trust as potential shareholders, the cost of equity is used as the discount rate, rather than the cost of capital (or weighted average cost of capital, WACC) which accounts for debt. In this calculation we've used 14%, which is based on a levered beta of 2.000. Beta is a measure of a stock's volatility, compared to the market as a whole. We get our beta from the industry average beta of globally comparable companies, with an imposed limit between 0.8 and 2.0, which is a reasonable range for a stable business.
我們要指出的是,貼現現金流的最重要投入是貼現率,當然還有實際的現金流。如果你不同意這些結果,那就自己去計算一下,試試假設。DCF也沒有考慮一個行業可能的週期性,也沒有考慮公司未來的資本需求,因此它沒有全面反映公司的潛在業績。鑑於我們將和記港口控股信託視爲潛在股東,因此權益成本被用作貼現率,而不是考慮債務的資本成本(或加權平均資本成本,WACC)。在此計算中,我們使用了14%,這是基於槓桿測試版2.000。Beta是衡量股票與整個市場相比波動性的指標。我們的beta來自全球可比公司的行業平均Beta值,施加的限制在0.8到2.0之間,對於穩定的業務來說,這是一個合理的區間。
SWOT Analysis for Hutchison Port Holdings Trust
和記港口控股信託基金的SWOT分析
- Debt is well covered by earnings.
- 債務可以很好地由收益支付。
- Dividend is in the top 25% of dividend payers in the market.
- 股息在市場上名列前25%的股息支付者。
- Dividend information for NS8U.
- NS8U 的股息信息。
- Earnings declined over the past year.
- 在過去的一年中,收益有所下降。
- Annual earnings are forecast to grow faster than the Singaporean market.
- 預計年收入的增長速度將快於新加坡市場。
- Good value based on P/E ratio and estimated fair value.
- 根據市盈率和估計的公允價值,物有所值。
- Debt is not well covered by operating cash flow.
- 運營現金流無法很好地覆蓋債務。
- Dividends are not covered by earnings.
- 股息不包括在收益中。
- Annual revenue is forecast to grow slower than the Singaporean market.
- 預計年收入的增長速度將低於新加坡市場。
- Is NS8U well equipped to handle threats?
- NS8U 是否有足夠的能力應對威脅?
Moving On:
繼續前進:
Whilst important, the DCF calculation is only one of many factors that you need to assess for a company. DCF models are not the be-all and end-all of investment valuation. Instead the best use for a DCF model is to test certain assumptions and theories to see if they would lead to the company being undervalued or overvalued. For instance, if the terminal value growth rate is adjusted slightly, it can dramatically alter the overall result. What is the reason for the share price sitting below the intrinsic value? For Hutchison Port Holdings Trust, we've compiled three further aspects you should explore:
儘管DCF計算很重要,但它只是公司需要評估的衆多因素之一。差價合約模型並不是投資估值的萬能藥。相反,DCF模型的最佳用途是測試某些假設和理論,看看它們是否會導致公司被低估或被高估。例如,如果稍微調整終端價值增長率,則可能會顯著改變總體結果。股價低於內在價值的原因是什麼?對於和記港口控股信託基金,我們彙總了你應該探索的另外三個方面:
- Risks: For instance, we've identified 3 warning signs for Hutchison Port Holdings Trust (1 is a bit concerning) you should be aware of.
- Future Earnings: How does NS8U's growth rate compare to its peers and the wider market? Dig deeper into the analyst consensus number for the upcoming years by interacting with our free analyst growth expectation chart.
- Other Solid Businesses: Low debt, high returns on equity and good past performance are fundamental to a strong business. Why not explore our interactive list of stocks with solid business fundamentals to see if there are other companies you may not have considered!
- 風險: 例如,我們已經確定了 和記港口控股信託基金有 3 個警告信號 (1 有點令人擔憂)你應該注意。
- 未來收益: 與同行和整個市場相比,NS8U的增長率如何?通過與我們的免費分析師增長預期圖表互動,深入了解未來幾年的分析師共識數字。
- 其他穩健的業務: 低債務、高股本回報率和良好的過往表現是強勁業務的基礎。爲什麼不瀏覽我們的互動式具有堅實商業基礎的股票清單,看看是否還有其他公司你可能沒有考慮過!
PS. Simply Wall St updates its DCF calculation for every Singaporean stock every day, so if you want to find the intrinsic value of any other stock just search here.
PS。Simply Wall St每天都會更新每隻新加坡股票的差價合約計算方法,因此,如果您想找到任何其他股票的內在價值,請在此處搜索。
Have feedback on this article? Concerned about the content? Get in touch with us directly. Alternatively, email editorial-team (at) simplywallst.com.
This article by Simply Wall St is general in nature. We provide commentary based on historical data and analyst forecasts only using an unbiased methodology and our articles are not intended to be financial advice. It does not constitute a recommendation to buy or sell any stock, and does not take account of your objectives, or your financial situation. We aim to bring you long-term focused analysis driven by fundamental data. Note that our analysis may not factor in the latest price-sensitive company announcements or qualitative material. Simply Wall St has no position in any stocks mentioned.
對這篇文章有反饋嗎?擔心內容嗎? 取得聯繫 直接和我們在一起。 或者,給編輯團隊 (at) simplywallst.com 發送電子郵件。
Simply Wall St 的這篇文章本質上是籠統的。 我們僅使用公正的方法根據歷史數據和分析師的預測提供評論,我們的文章無意作爲財務建議。 它不構成買入或賣出任何股票的建議,也沒有考慮您的目標或財務狀況。我們的目標是爲您提供由基本面數據驅動的長期重點分析。請注意,我們的分析可能不考慮最新的價格敏感公司公告或定性材料。簡而言之,華爾街在上述任何股票中都沒有頭寸。
譯文內容由第三人軟體翻譯。