Is ST Group Food Industries Holdings Limited's (Catalist:DRX) Recent Performance Underpinned By Weak Financials?
ST Group Food Industries Holdings (Catalist:DRX) has had a rough three months with its share price down 10%. To decide if this trend could continue, we decided to look at its weak fundamentals as they shape the long-term market trends. Specifically, we decided to study ST Group Food Industries Holdings' ROE in this article.
Return on equity or ROE is an important factor to be considered by a shareholder because it tells them how effectively their capital is being reinvested. In short, ROE shows the profit each dollar generates with respect to its shareholder investments.
See our latest analysis for ST Group Food Industries Holdings
How Is ROE Calculated?
The formula for return on equity is:
Return on Equity = Net Profit (from continuing operations) ÷ Shareholders' Equity
So, based on the above formula, the ROE for ST Group Food Industries Holdings is:
1.4% = AU$289k ÷ AU$21m (Based on the trailing twelve months to December 2022).
The 'return' is the yearly profit. So, this means that for every SGD1 of its shareholder's investments, the company generates a profit of SGD0.01.
Why Is ROE Important For Earnings Growth?
So far, we've learned that ROE is a measure of a company's profitability. We now need to evaluate how much profit the company reinvests or "retains" for future growth which then gives us an idea about the growth potential of the company. Assuming all else is equal, companies that have both a higher return on equity and higher profit retention are usually the ones that have a higher growth rate when compared to companies that don't have the same features.
ST Group Food Industries Holdings' Earnings Growth And 1.4% ROE
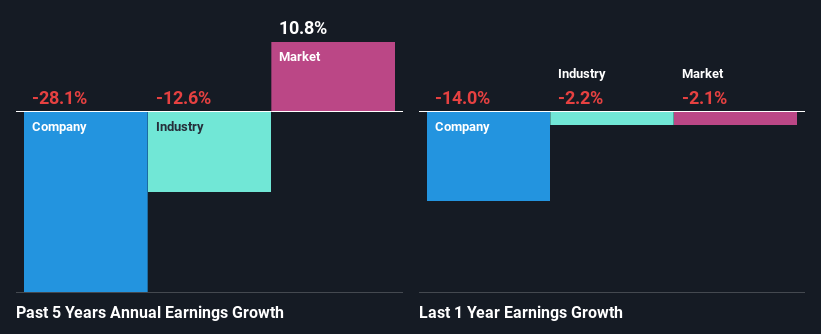
It is hard to argue that ST Group Food Industries Holdings' ROE is much good in and of itself. Not just that, even compared to the industry average of 7.9%, the company's ROE is entirely unremarkable. For this reason, ST Group Food Industries Holdings' five year net income decline of 28% is not surprising given its lower ROE. We believe that there also might be other aspects that are negatively influencing the company's earnings prospects. For instance, the company has a very high payout ratio, or is faced with competitive pressures.
Next, when we compared with the industry, which has shrunk its earnings at a rate of 13% in the same 5-year period, we still found ST Group Food Industries Holdings' performance to be quite bleak, because the company has been shrinking its earnings faster than the industry.
Earnings growth is an important metric to consider when valuing a stock. The investor should try to establish if the expected growth or decline in earnings, whichever the case may be, is priced in. This then helps them determine if the stock is placed for a bright or bleak future. If you're wondering about ST Group Food Industries Holdings''s valuation, check out this gauge of its price-to-earnings ratio, as compared to its industry.
Is ST Group Food Industries Holdings Making Efficient Use Of Its Profits?
ST Group Food Industries Holdings has a high three-year median payout ratio of 61% (that is, it is retaining 39% of its profits). This suggests that the company is paying most of its profits as dividends to its shareholders. This goes some way in explaining why its earnings have been shrinking. With only very little left to reinvest into the business, growth in earnings is far from likely. You can see the 5 risks we have identified for ST Group Food Industries Holdings by visiting our risks dashboard for free on our platform here.
Additionally, ST Group Food Industries Holdings has paid dividends over a period of three years, which means that the company's management is rather focused on keeping up its dividend payments, regardless of the shrinking earnings.
Conclusion
On the whole, ST Group Food Industries Holdings' performance is quite a big let-down. Because the company is not reinvesting much into the business, and given the low ROE, it's not surprising to see the lack or absence of growth in its earnings. So far, we've only made a quick discussion around the company's earnings growth. You can do your own research on ST Group Food Industries Holdings and see how it has performed in the past by looking at this FREE detailed graph of past earnings, revenue and cash flows.
Have feedback on this article? Concerned about the content? Get in touch with us directly. Alternatively, email editorial-team (at) simplywallst.com.
This article by Simply Wall St is general in nature. We provide commentary based on historical data and analyst forecasts only using an unbiased methodology and our articles are not intended to be financial advice. It does not constitute a recommendation to buy or sell any stock, and does not take account of your objectives, or your financial situation. We aim to bring you long-term focused analysis driven by fundamental data. Note that our analysis may not factor in the latest price-sensitive company announcements or qualitative material. Simply Wall St has no position in any stocks mentioned.
Join A Paid User Research Session
You’ll receive a US$30 Amazon Gift card for 1 hour of your time while helping us build better investing tools for the individual investors like yourself. Sign up here
