
Star Bulk Carriers (NASDAQ:SBLK) has had a rough three months with its share price down 18%. But if you pay close attention, you might gather that its strong financials could mean that the stock could potentially see an increase in value in the long-term, given how markets usually reward companies with good financial health. Specifically, we decided to study Star Bulk Carriers' ROE in this article.
ROE or return on equity is a useful tool to assess how effectively a company can generate returns on the investment it received from its shareholders. In simpler terms, it measures the profitability of a company in relation to shareholder's equity.
See our latest analysis for Star Bulk Carriers
How To Calculate Return On Equity?
The formula for return on equity is:
Return on Equity = Net Profit (from continuing operations) ÷ Shareholders' Equity
So, based on the above formula, the ROE for Star Bulk Carriers is:
22% = US$442m ÷ US$2.0b (Based on the trailing twelve months to March 2023).
The 'return' is the profit over the last twelve months. Another way to think of that is that for every $1 worth of equity, the company was able to earn $0.22 in profit.
What Has ROE Got To Do With Earnings Growth?
Thus far, we have learned that ROE measures how efficiently a company is generating its profits. Depending on how much of these profits the company reinvests or "retains", and how effectively it does so, we are then able to assess a company's earnings growth potential. Assuming everything else remains unchanged, the higher the ROE and profit retention, the higher the growth rate of a company compared to companies that don't necessarily bear these characteristics.
Star Bulk Carriers' Earnings Growth And 22% ROE
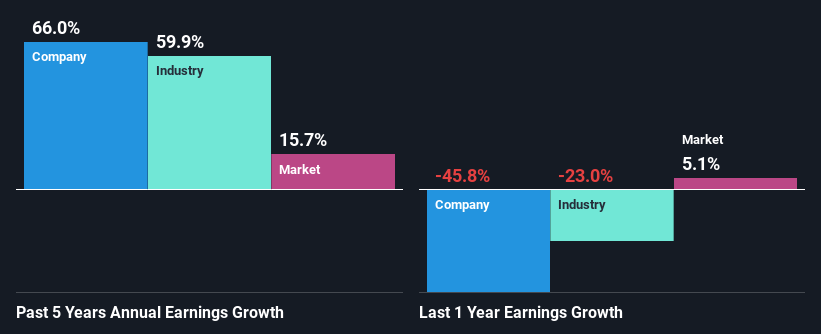
Firstly, we acknowledge that Star Bulk Carriers has a significantly high ROE. Even when compared to the industry average of 22% the company's ROE is pretty decent. Therefore, it might not be wrong to say that the impressive five year 66% net income growth seen by Star Bulk Carriers was probably achieved as a result of the high ROE.
Next, on comparing Star Bulk Carriers' net income growth with the industry, we found that the company's reported growth is similar to the industry average growth rate of 60% over the last few years.
Earnings growth is a huge factor in stock valuation. What investors need to determine next is if the expected earnings growth, or the lack of it, is already built into the share price. Doing so will help them establish if the stock's future looks promising or ominous. Is Star Bulk Carriers fairly valued compared to other companies? These 3 valuation measures might help you decide.
Is Star Bulk Carriers Making Efficient Use Of Its Profits?
Star Bulk Carriers has a significant three-year median payout ratio of 70%, meaning the company only retains 30% of its income. This implies that the company has been able to achieve high earnings growth despite returning most of its profits to shareholders.
Besides, Star Bulk Carriers has been paying dividends over a period of four years. This shows that the company is committed to sharing profits with its shareholders. Looking at the current analyst consensus data, we can see that the company's future payout ratio is expected to rise to 89% over the next three years. Regardless, the ROE is not expected to change much for the company despite the higher expected payout ratio.
Summary
Overall, we are quite pleased with Star Bulk Carriers' performance. In particular, its high ROE is quite noteworthy and also the probable explanation behind its considerable earnings growth. Yet, the company is retaining a small portion of its profits. Which means that the company has been able to grow its earnings in spite of it, so that's not too bad. Having said that, the company's earnings growth is expected to slow down, as forecasted in the current analyst estimates. To know more about the latest analysts predictions for the company, check out this visualization of analyst forecasts for the company.
Have feedback on this article? Concerned about the content? Get in touch with us directly. Alternatively, email editorial-team (at) simplywallst.com.
This article by Simply Wall St is general in nature. We provide commentary based on historical data and analyst forecasts only using an unbiased methodology and our articles are not intended to be financial advice. It does not constitute a recommendation to buy or sell any stock, and does not take account of your objectives, or your financial situation. We aim to bring you long-term focused analysis driven by fundamental data. Note that our analysis may not factor in the latest price-sensitive company announcements or qualitative material. Simply Wall St has no position in any stocks mentioned.