
 Yahoo Finance
 Ying Li International Real Estate (SGX:5DM) adds S$7.7m to market cap in the past 7 days, though investors from five years ago are still down 72%
Ying Li International Real Estate Limited (SGX:5DM) shareholders should be happy to see the share price up 12% in the last week. But that doesn't change the fact that the returns over the last half decade have been stomach churning. In fact, the share price has tumbled down a mountain to land 72% lower after that period. The recent bounce might mean the long decline is over, but we are not confident. The important question is if the business itself justifies a higher share price in the long term.
The recent uptick of 12% could be a positive sign of things to come, so let's take a look at historical fundamentals.
See our latest analysis for Ying Li International Real Estate
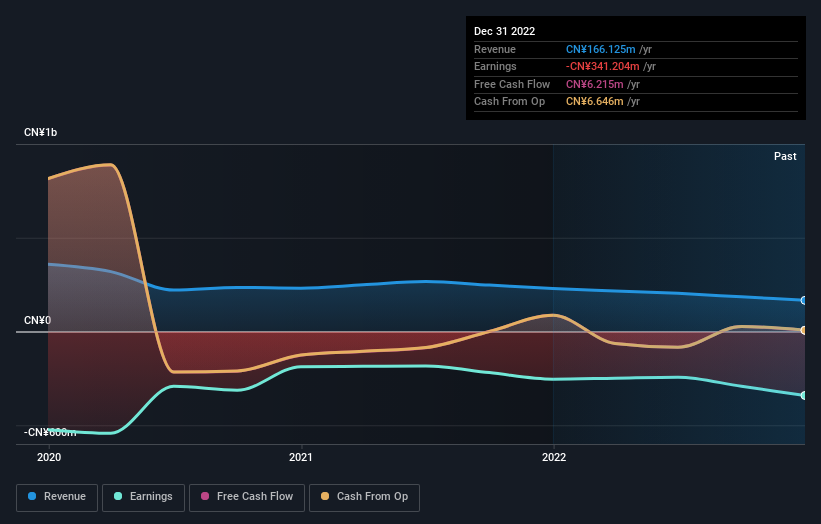
Given that Ying Li International Real Estate didn't make a profit in the last twelve months, we'll focus on revenue growth to form a quick view of its business development. Generally speaking, companies without profits are expected to grow revenue every year, and at a good clip. That's because it's hard to be confident a company will be sustainable if revenue growth is negligible, and it never makes a profit.
In the last five years Ying Li International Real Estate saw its revenue shrink by 41% per year. That's definitely a weaker result than most pre-profit companies report. So it's not altogether surprising to see the share price down 12% per year in the same time period. We don't think this is a particularly promising picture. Of course, the poor performance could mean the market has been too severe selling down. That can happen.
You can see how earnings and revenue have changed over time in the image below (click on the chart to see the exact values).
You can see how its balance sheet has strengthened (or weakened) over time in this free interactive graphic.
A Different Perspective
While the broader market gained around 4.6% in the last year, Ying Li International Real Estate shareholders lost 46%. However, keep in mind that even the best stocks will sometimes underperform the market over a twelve month period. Unfortunately, last year's performance may indicate unresolved challenges, given that it was worse than the annualised loss of 12% over the last half decade. Generally speaking long term share price weakness can be a bad sign, though contrarian investors might want to research the stock in hope of a turnaround. I find it very interesting to look at share price over the long term as a proxy for business performance. But to truly gain insight, we need to consider other information, too. Even so, be aware that Ying Li International Real Estate is showing 4 warning signs in our investment analysis , and 2 of those are significant...
Of course, you might find a fantastic investment by looking elsewhere. So take a peek at this free list of companies we expect will grow earnings.
Please note, the market returns quoted in this article reflect the market weighted average returns of stocks that currently trade on Singaporean exchanges.
Have feedback on this article? Concerned about the content? Get in touch with us directly. Alternatively, email editorial-team (at) simplywallst.com.
This article by Simply Wall St is general in nature. We provide commentary based on historical data and analyst forecasts only using an unbiased methodology and our articles are not intended to be financial advice. It does not constitute a recommendation to buy or sell any stock, and does not take account of your objectives, or your financial situation. We aim to bring you long-term focused analysis driven by fundamental data. Note that our analysis may not factor in the latest price-sensitive company announcements or qualitative material. Simply Wall St has no position in any stocks mentioned.
Join A Paid User Research Session
You’ll receive a US$30 Amazon Gift card for 1 hour of your time while helping us build better investing tools for the individual investors like yourself. Sign up here
