
 Yahoo Finance
 The Returns On Capital At AVJennings (ASX:AVJ) Don't Inspire Confidence
If you're looking at a mature business that's past the growth phase, what are some of the underlying trends that pop up? Businesses in decline often have two underlying trends, firstly, a declining return on capital employed (ROCE) and a declining base of capital employed. This indicates the company is producing less profit from its investments and its total assets are decreasing. On that note, looking into AVJennings (ASX:AVJ), we weren't too upbeat about how things were going.
Return On Capital Employed (ROCE): What Is It?
Just to clarify if you're unsure, ROCE is a metric for evaluating how much pre-tax income (in percentage terms) a company earns on the capital invested in its business. The formula for this calculation on AVJennings is:
Return on Capital Employed = Earnings Before Interest and Tax (EBIT) ÷ (Total Assets - Current Liabilities)
0.037 = AU$26m ÷ (AU$846m - AU$132m) (Based on the trailing twelve months to December 2022).
So, AVJennings has an ROCE of 3.7%. Ultimately, that's a low return and it under-performs the Consumer Durables industry average of 11%.
See our latest analysis for AVJennings
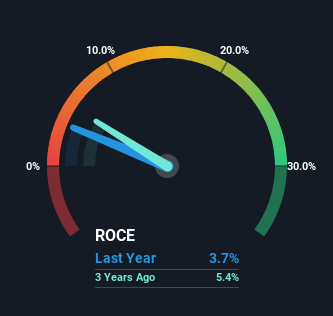
Historical performance is a great place to start when researching a stock so above you can see the gauge for AVJennings' ROCE against it's prior returns. If you're interested in investigating AVJennings' past further, check out this free graph of past earnings, revenue and cash flow.
The Trend Of ROCE
There is reason to be cautious about AVJennings, given the returns are trending downwards. About five years ago, returns on capital were 8.1%, however they're now substantially lower than that as we saw above. And on the capital employed front, the business is utilizing roughly the same amount of capital as it was back then. Companies that exhibit these attributes tend to not be shrinking, but they can be mature and facing pressure on their margins from competition. So because these trends aren't typically conducive to creating a multi-bagger, we wouldn't hold our breath on AVJennings becoming one if things continue as they have.
The Key Takeaway
In the end, the trend of lower returns on the same amount of capital isn't typically an indication that we're looking at a growth stock. Investors haven't taken kindly to these developments, since the stock has declined 31% from where it was five years ago. With underlying trends that aren't great in these areas, we'd consider looking elsewhere.
AVJennings does come with some risks though, we found 2 warning signs in our investment analysis, and 1 of those makes us a bit uncomfortable...
If you want to search for solid companies with great earnings, check out this free list of companies with good balance sheets and impressive returns on equity.
Have feedback on this article? Concerned about the content? Get in touch with us directly. Alternatively, email editorial-team (at) simplywallst.com.
This article by Simply Wall St is general in nature. We provide commentary based on historical data and analyst forecasts only using an unbiased methodology and our articles are not intended to be financial advice. It does not constitute a recommendation to buy or sell any stock, and does not take account of your objectives, or your financial situation. We aim to bring you long-term focused analysis driven by fundamental data. Note that our analysis may not factor in the latest price-sensitive company announcements or qualitative material. Simply Wall St has no position in any stocks mentioned.
Join A Paid User Research Session
You’ll receive a US$30 Amazon Gift card for 1 hour of your time while helping us build better investing tools for the individual investors like yourself. Sign up here
