
 Yahoo Finance
 Returns Are Gaining Momentum At Steamships Trading (ASX:SST)
There are a few key trends to look for if we want to identify the next multi-bagger. Firstly, we'd want to identify a growing return on capital employed (ROCE) and then alongside that, an ever-increasing base of capital employed. Put simply, these types of businesses are compounding machines, meaning they are continually reinvesting their earnings at ever-higher rates of return. With that in mind, we've noticed some promising trends at Steamships Trading (ASX:SST) so let's look a bit deeper.
What Is Return On Capital Employed (ROCE)?
For those that aren't sure what ROCE is, it measures the amount of pre-tax profits a company can generate from the capital employed in its business. The formula for this calculation on Steamships Trading is:
Return on Capital Employed = Earnings Before Interest and Tax (EBIT) ÷ (Total Assets - Current Liabilities)
0.093 = K108m ÷ (K1.5b - K359m) (Based on the trailing twelve months to December 2022).
So, Steamships Trading has an ROCE of 9.3%. On its own that's a low return, but compared to the average of 7.4% generated by the Industrials industry, it's much better.
See our latest analysis for Steamships Trading
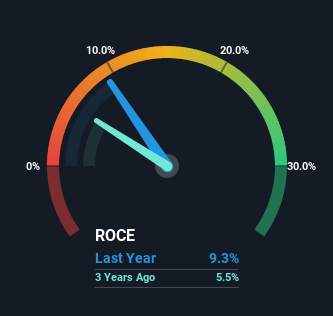
Historical performance is a great place to start when researching a stock so above you can see the gauge for Steamships Trading's ROCE against it's prior returns. If you're interested in investigating Steamships Trading's past further, check out this free graph of past earnings, revenue and cash flow.
The Trend Of ROCE
Steamships Trading is showing promise given that its ROCE is trending up and to the right. More specifically, while the company has kept capital employed relatively flat over the last five years, the ROCE has climbed 81% in that same time. Basically the business is generating higher returns from the same amount of capital and that is proof that there are improvements in the company's efficiencies. The company is doing well in that sense, and it's worth investigating what the management team has planned for long term growth prospects.
The Bottom Line On Steamships Trading's ROCE
To bring it all together, Steamships Trading has done well to increase the returns it's generating from its capital employed. And since the stock has fallen 36% over the last five years, there might be an opportunity here. With that in mind, we believe the promising trends warrant this stock for further investigation.
If you want to know some of the risks facing Steamships Trading we've found 4 warning signs (1 doesn't sit too well with us!) that you should be aware of before investing here.
While Steamships Trading may not currently earn the highest returns, we've compiled a list of companies that currently earn more than 25% return on equity. Check out this free list here.
Have feedback on this article? Concerned about the content? Get in touch with us directly. Alternatively, email editorial-team (at) simplywallst.com.
This article by Simply Wall St is general in nature. We provide commentary based on historical data and analyst forecasts only using an unbiased methodology and our articles are not intended to be financial advice. It does not constitute a recommendation to buy or sell any stock, and does not take account of your objectives, or your financial situation. We aim to bring you long-term focused analysis driven by fundamental data. Note that our analysis may not factor in the latest price-sensitive company announcements or qualitative material. Simply Wall St has no position in any stocks mentioned.
Join A Paid User Research Session
You’ll receive a US$30 Amazon Gift card for 1 hour of your time while helping us build better investing tools for the individual investors like yourself. Sign up here
