
 Yahoo Finance
 Investors in Fluence (ASX:FLC) have unfortunately lost 56% over the last five years
Generally speaking long term investing is the way to go. But that doesn't mean long term investors can avoid big losses. For example, after five long years the Fluence Corporation Limited (ASX:FLC) share price is a whole 56% lower. That's an unpleasant experience for long term holders. And some of the more recent buyers are probably worried, too, with the stock falling 29% in the last year.
With that in mind, it's worth seeing if the company's underlying fundamentals have been the driver of long term performance, or if there are some discrepancies.
Check out our latest analysis for Fluence
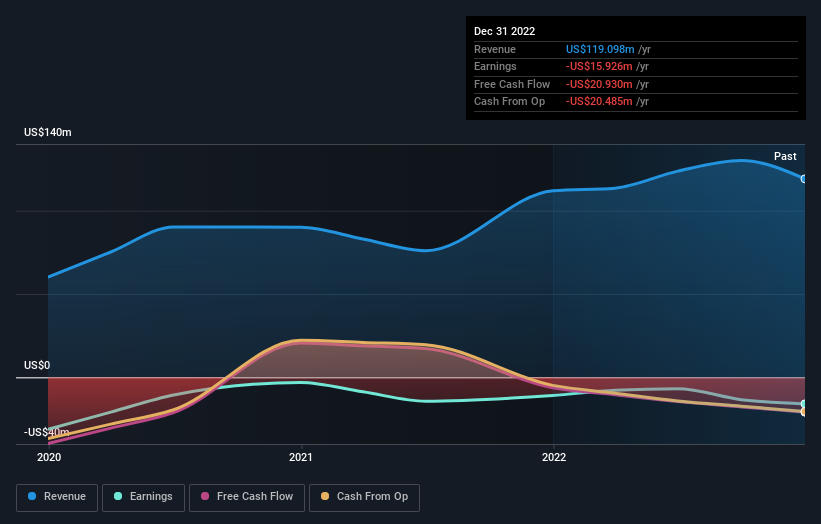
Given that Fluence didn't make a profit in the last twelve months, we'll focus on revenue growth to form a quick view of its business development. When a company doesn't make profits, we'd generally expect to see good revenue growth. As you can imagine, fast revenue growth, when maintained, often leads to fast profit growth.
Over five years, Fluence grew its revenue at 14% per year. That's a pretty good rate for a long time period. The share price return isn't so respectable with an annual loss of 9% over the period. That suggests the market is disappointed with the current growth rate. That could lead to an opportunity if the company is going to become profitable sooner rather than later.
The graphic below depicts how earnings and revenue have changed over time (unveil the exact values by clicking on the image).
Take a more thorough look at Fluence's financial health with this free report on its balance sheet.
A Different Perspective
Investors in Fluence had a tough year, with a total loss of 29%, against a market gain of about 3.6%. However, keep in mind that even the best stocks will sometimes underperform the market over a twelve month period. Unfortunately, last year's performance may indicate unresolved challenges, given that it was worse than the annualised loss of 9% over the last half decade. Generally speaking long term share price weakness can be a bad sign, though contrarian investors might want to research the stock in hope of a turnaround. I find it very interesting to look at share price over the long term as a proxy for business performance. But to truly gain insight, we need to consider other information, too. Consider for instance, the ever-present spectre of investment risk. We've identified 2 warning signs with Fluence (at least 1 which is a bit unpleasant) , and understanding them should be part of your investment process.
Of course Fluence may not be the best stock to buy. So you may wish to see this free collection of growth stocks.
Please note, the market returns quoted in this article reflect the market weighted average returns of stocks that currently trade on Australian exchanges.
Have feedback on this article? Concerned about the content? Get in touch with us directly. Alternatively, email editorial-team (at) simplywallst.com.
This article by Simply Wall St is general in nature. We provide commentary based on historical data and analyst forecasts only using an unbiased methodology and our articles are not intended to be financial advice. It does not constitute a recommendation to buy or sell any stock, and does not take account of your objectives, or your financial situation. We aim to bring you long-term focused analysis driven by fundamental data. Note that our analysis may not factor in the latest price-sensitive company announcements or qualitative material. Simply Wall St has no position in any stocks mentioned.
Join A Paid User Research Session
You’ll receive a US$30 Amazon Gift card for 1 hour of your time while helping us build better investing tools for the individual investors like yourself. Sign up here
