
 Yahoo Finance
 Sinostar PEC Holdings (SGX:C9Q) investors are sitting on a loss of 33% if they invested a year ago
Investors can approximate the average market return by buying an index fund. While individual stocks can be big winners, plenty more fail to generate satisfactory returns. That downside risk was realized by Sinostar PEC Holdings Limited (SGX:C9Q) shareholders over the last year, as the share price declined 33%. That's disappointing when you consider the market declined 0.6%. On the bright side, the stock is actually up 4.0% in the last three years. Furthermore, it's down 18% in about a quarter. That's not much fun for holders.
So let's have a look and see if the longer term performance of the company has been in line with the underlying business' progress.
See our latest analysis for Sinostar PEC Holdings
There is no denying that markets are sometimes efficient, but prices do not always reflect underlying business performance. One flawed but reasonable way to assess how sentiment around a company has changed is to compare the earnings per share (EPS) with the share price.
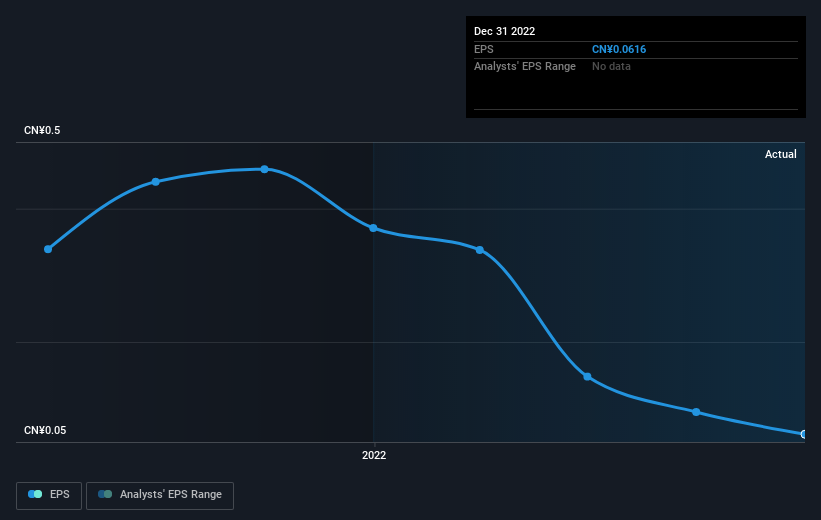
Unfortunately Sinostar PEC Holdings reported an EPS drop of 83% for the last year. This fall in the EPS is significantly worse than the 33% the share price fall. It may have been that the weak EPS was not as bad as some had feared.
The graphic below depicts how EPS has changed over time (unveil the exact values by clicking on the image).
This free interactive report on Sinostar PEC Holdings' earnings, revenue and cash flow is a great place to start, if you want to investigate the stock further.
A Different Perspective
While the broader market lost about 0.6% in the twelve months, Sinostar PEC Holdings shareholders did even worse, losing 33%. However, it could simply be that the share price has been impacted by broader market jitters. It might be worth keeping an eye on the fundamentals, in case there's a good opportunity. Regrettably, last year's performance caps off a bad run, with the shareholders facing a total loss of 0.4% per year over five years. We realise that Baron Rothschild has said investors should "buy when there is blood on the streets", but we caution that investors should first be sure they are buying a high quality business. I find it very interesting to look at share price over the long term as a proxy for business performance. But to truly gain insight, we need to consider other information, too. Consider for instance, the ever-present spectre of investment risk. We've identified 3 warning signs with Sinostar PEC Holdings (at least 1 which makes us a bit uncomfortable) , and understanding them should be part of your investment process.
But note: Sinostar PEC Holdings may not be the best stock to buy. So take a peek at this free list of interesting companies with past earnings growth (and further growth forecast).
Please note, the market returns quoted in this article reflect the market weighted average returns of stocks that currently trade on Singaporean exchanges.
Have feedback on this article? Concerned about the content? Get in touch with us directly. Alternatively, email editorial-team (at) simplywallst.com.
This article by Simply Wall St is general in nature. We provide commentary based on historical data and analyst forecasts only using an unbiased methodology and our articles are not intended to be financial advice. It does not constitute a recommendation to buy or sell any stock, and does not take account of your objectives, or your financial situation. We aim to bring you long-term focused analysis driven by fundamental data. Note that our analysis may not factor in the latest price-sensitive company announcements or qualitative material. Simply Wall St has no position in any stocks mentioned.
Join A Paid User Research Session
You’ll receive a US$30 Amazon Gift card for 1 hour of your time while helping us build better investing tools for the individual investors like yourself. Sign up here
