
 Yahoo Finance
 Taka Jewellery Holdings (Catalist:42L) Is Doing The Right Things To Multiply Its Share Price
To find a multi-bagger stock, what are the underlying trends we should look for in a business? One common approach is to try and find a company with returns on capital employed (ROCE) that are increasing, in conjunction with a growing amount of capital employed. Put simply, these types of businesses are compounding machines, meaning they are continually reinvesting their earnings at ever-higher rates of return. So when we looked at Taka Jewellery Holdings (Catalist:42L) and its trend of ROCE, we really liked what we saw.
Understanding Return On Capital Employed (ROCE)
For those that aren't sure what ROCE is, it measures the amount of pre-tax profits a company can generate from the capital employed in its business. The formula for this calculation on Taka Jewellery Holdings is:
Return on Capital Employed = Earnings Before Interest and Tax (EBIT) ÷ (Total Assets - Current Liabilities)
0.087 = S$12m ÷ (S$193m - S$59m) (Based on the trailing twelve months to December 2022).
Thus, Taka Jewellery Holdings has an ROCE of 8.7%. Even though it's in line with the industry average of 8.6%, it's still a low return by itself.
Check out our latest analysis for Taka Jewellery Holdings
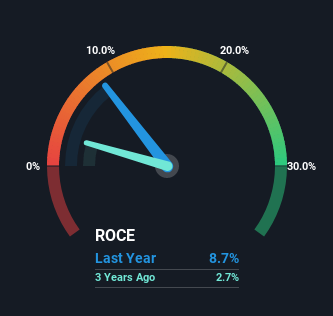
Historical performance is a great place to start when researching a stock so above you can see the gauge for Taka Jewellery Holdings' ROCE against it's prior returns. If you'd like to look at how Taka Jewellery Holdings has performed in the past in other metrics, you can view this free graph of past earnings, revenue and cash flow.
What Does the ROCE Trend For Taka Jewellery Holdings Tell Us?
Even though ROCE is still low in absolute terms, it's good to see it's heading in the right direction. The data shows that returns on capital have increased substantially over the last five years to 8.7%. The amount of capital employed has increased too, by 30%. So we're very much inspired by what we're seeing at Taka Jewellery Holdings thanks to its ability to profitably reinvest capital.
In Conclusion...
All in all, it's terrific to see that Taka Jewellery Holdings is reaping the rewards from prior investments and is growing its capital base. Astute investors may have an opportunity here because the stock has declined 16% in the last five years. So researching this company further and determining whether or not these trends will continue seems justified.
On a final note, we found 2 warning signs for Taka Jewellery Holdings (1 can't be ignored) you should be aware of.
For those who like to invest in solid companies, check out this free list of companies with solid balance sheets and high returns on equity.
Have feedback on this article? Concerned about the content? Get in touch with us directly. Alternatively, email editorial-team (at) simplywallst.com.
This article by Simply Wall St is general in nature. We provide commentary based on historical data and analyst forecasts only using an unbiased methodology and our articles are not intended to be financial advice. It does not constitute a recommendation to buy or sell any stock, and does not take account of your objectives, or your financial situation. We aim to bring you long-term focused analysis driven by fundamental data. Note that our analysis may not factor in the latest price-sensitive company announcements or qualitative material. Simply Wall St has no position in any stocks mentioned.
Join A Paid User Research Session
You’ll receive a US$30 Amazon Gift card for 1 hour of your time while helping us build better investing tools for the individual investors like yourself. Sign up here
