
Calculating The Fair Value Of Autodesk, Inc. (NASDAQ:ADSK)
Calculating The Fair Value Of Autodesk, Inc. (NASDAQ:ADSK)
Key Insights
关键见解
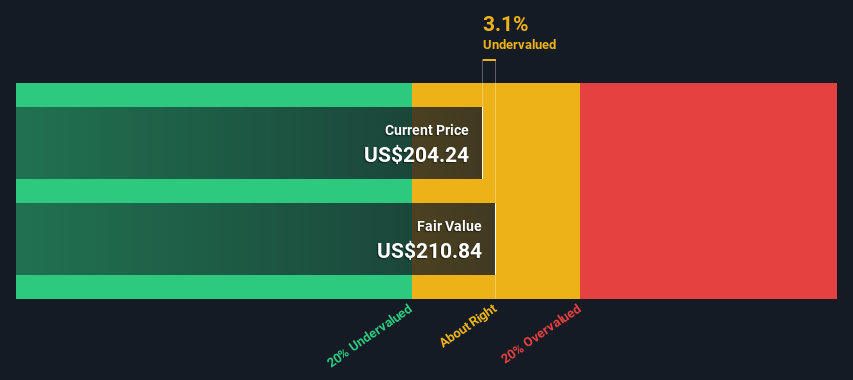
- Using the 2 Stage Free Cash Flow to Equity, Autodesk fair value estimate is US$211
- Autodesk's US$204 share price indicates it is trading at similar levels as its fair value estimate
- The US$230 analyst price target for ADSK is 8.9% more than our estimate of fair value
- 根据两阶段自由现金流向权益,Autodesk的公允价值估计为211美元
- Autodesk的204美元股价表明,其交易价格与其公允价值估计的水平相似
- 分析师对ADSK的230美元目标股价比我们对公允价值的估计高出8.9%
Today we will run through one way of estimating the intrinsic value of Autodesk, Inc. (NASDAQ:ADSK) by taking the forecast future cash flows of the company and discounting them back to today's value. This will be done using the Discounted Cash Flow (DCF) model. Before you think you won't be able to understand it, just read on! It's actually much less complex than you'd imagine.
今天,我们将介绍一种估算Autodesk, Inc.(纳斯达克股票代码:ADSK)内在价值的方法,方法是将公司预测的未来现金流折现回今天的价值。这将使用贴现现金流 (DCF) 模型来完成。在你认为自己无法理解之前,请继续阅读吧!实际上,它比你想象的要复杂得多。
We generally believe that a company's value is the present value of all of the cash it will generate in the future. However, a DCF is just one valuation metric among many, and it is not without flaws. If you want to learn more about discounted cash flow, the rationale behind this calculation can be read in detail in the Simply Wall St analysis model.
我们普遍认为,公司的价值是其未来将产生的所有现金的现值。但是,差价合约只是众多估值指标中的一个,而且并非没有缺陷。如果您想了解有关折扣现金流的更多信息,可以在Simply Wall St分析模型中详细了解此计算背后的理由。
See our latest analysis for Autodesk
查看我们对 Autodesk 的最新分析
What's The Estimated Valuation?
估计估值是多少?
We are going to use a two-stage DCF model, which, as the name states, takes into account two stages of growth. The first stage is generally a higher growth period which levels off heading towards the terminal value, captured in the second 'steady growth' period. In the first stage we need to estimate the cash flows to the business over the next ten years. Where possible we use analyst estimates, but when these aren't available we extrapolate the previous free cash flow (FCF) from the last estimate or reported value. We assume companies with shrinking free cash flow will slow their rate of shrinkage, and that companies with growing free cash flow will see their growth rate slow, over this period. We do this to reflect that growth tends to slow more in the early years than it does in later years.
我们将使用两阶段的DCF模型,顾名思义,该模型考虑了两个增长阶段。第一阶段通常是较高的增长期,在第二个 “稳步增长” 时期逐渐趋于平稳,最终值是第二个 “稳定增长” 时期。在第一阶段,我们需要估算未来十年的业务现金流。在可能的情况下,我们会使用分析师的估计值,但是当这些估计值不可用时,我们会从最新的估计值或报告的价值中推断出之前的自由现金流(FCF)。我们假设自由现金流萎缩的公司将减缓其萎缩速度,而自由现金流不断增长的公司在此期间的增长率将放缓。我们这样做是为了反映早期增长的放缓幅度往往比后来的几年更大。
A DCF is all about the idea that a dollar in the future is less valuable than a dollar today, and so the sum of these future cash flows is then discounted to today's value:
差价合约就是关于未来一美元的价值低于今天一美元的概念,因此,这些未来现金流的总和将折现为今天的价值:
10-year free cash flow (FCF) forecast
10 年自由现金流 (FCF) 预测
| 2023 | 2024 | 2025 | 2026 | 2027 | 2028 | 2029 | 2030 | 2031 | 2032 | |
| Levered FCF ($, Millions) | US$1.97b | US$1.24b | US$1.65b | US$2.19b | US$2.42b | US$2.83b | US$3.14b | US$3.40b | US$3.62b | US$3.81b |
| Growth Rate Estimate Source | Analyst x14 | Analyst x16 | Analyst x15 | Analyst x6 | Analyst x1 | Analyst x1 | Est @ 10.89% | Est @ 8.26% | Est @ 6.41% | Est @ 5.12% |
| Present Value ($, Millions) Discounted @ 8.2% | US$1.8k | US$1.1k | US$1.3k | US$1.6k | US$1.6k | US$1.8k | US$1.8k | US$1.8k | US$1.8k | US$1.7k |
| 2023 | 2024 | 2025 | 2026 | 2027 | 2028 | 2029 | 2030 | 2031 | 2032 | |
| Levered FCF(美元,百万) | 19.7 亿美元 | 12.4 亿美元 | 16.5 亿美元 | 21.9 亿美元 | 24.2 亿美元 | 28.3 亿美元 | 31.4 亿美元 | 340 亿美元 | 36.2b 美元 | 381 亿美元 |
| 增长率估算来源 | 分析师 x14 | 分析师 x16 | 分析师 x15 | 分析师 x6 | 分析师 x1 | 分析师 x1 | 美国东部标准时间 @ 10.89% | Est @ 8.26% | 美国东部标准时间 @ 6.41% | Est @ 5.12% |
| 现值(美元,百万)折扣 @ 8.2% | 180 万美元 | 1.1 万美元 | 130 万美元 | 160 万美元 | 160 万美元 | 180 万美元 | 180 万美元 | 180 万美元 | 180 万美元 | 17k 美元 |
("Est" = FCF growth rate estimated by Simply Wall St)
Present Value of 10-year Cash Flow (PVCF) = US$16b
(“Est” = Simply Wall St估计的FCF增长率)
10年期现金流(PVCF)的现值 = 160 亿美元
We now need to calculate the Terminal Value, which accounts for all the future cash flows after this ten year period. The Gordon Growth formula is used to calculate Terminal Value at a future annual growth rate equal to the 5-year average of the 10-year government bond yield of 2.1%. We discount the terminal cash flows to today's value at a cost of equity of 8.2%.
我们现在需要计算终端价值,它考虑了十年之后的所有未来现金流。戈登增长公式用于计算终端价值,其未来年增长率等于10年期政府债券收益率2.1%的5年平均值。我们将终端现金流折现为今天的价值,权益成本为8.2%。
Terminal Value (TV)= FCF2032 × (1 + g) ÷ (r – g) = US$3.8b× (1 + 2.1%) ÷ (8.2%– 2.1%) = US$63b
终端价值 (TV)= FCF2032 × (1 + g) ÷ (r — g) = 38b× (1 + 2.1%) ÷ (8.2% — 2.1%) = 630亿美元
Present Value of Terminal Value (PVTV)= TV / (1 + r)10= US$63b÷ ( 1 + 8.2%)10= US$29b
终端价值的现值 (PVTV)= 电视/ (1 + r)10= 63b 美元÷ (1 + 8.2%)10= 290 亿美元
The total value is the sum of cash flows for the next ten years plus the discounted terminal value, which results in the Total Equity Value, which in this case is US$45b. The last step is to then divide the equity value by the number of shares outstanding. Compared to the current share price of US$204, the company appears about fair value at a 3.1% discount to where the stock price trades currently. The assumptions in any calculation have a big impact on the valuation, so it is better to view this as a rough estimate, not precise down to the last cent.
总价值是未来十年的现金流总和加上贴现的终端价值,由此得出总权益价值,在本例中为450亿美元。最后一步是将股票价值除以已发行股票的数量。与目前的204美元股价相比,该公司的公允价值似乎比目前的股价折扣了3.1%。任何计算中的假设都会对估值产生重大影响,因此最好将其视为粗略的估计,而不是精确到最后一美分。
Important Assumptions
重要假设
The calculation above is very dependent on two assumptions. The first is the discount rate and the other is the cash flows. Part of investing is coming up with your own evaluation of a company's future performance, so try the calculation yourself and check your own assumptions. The DCF also does not consider the possible cyclicality of an industry, or a company's future capital requirements, so it does not give a full picture of a company's potential performance. Given that we are looking at Autodesk as potential shareholders, the cost of equity is used as the discount rate, rather than the cost of capital (or weighted average cost of capital, WACC) which accounts for debt. In this calculation we've used 8.2%, which is based on a levered beta of 1.031. Beta is a measure of a stock's volatility, compared to the market as a whole. We get our beta from the industry average beta of globally comparable companies, with an imposed limit between 0.8 and 2.0, which is a reasonable range for a stable business.
上面的计算在很大程度上取决于两个假设。第一个是贴现率,另一个是现金流量。投资的一部分是自己对公司未来业绩的评估,因此请自己尝试计算并检查自己的假设。DCF也没有考虑一个行业可能的周期性,也没有考虑公司未来的资本需求,因此它没有全面描述公司的潜在表现。鉴于我们将Autodesk视为潜在股东,因此使用股权成本作为贴现率,而不是构成债务的资本成本(或加权平均资本成本,WACC)。在此计算中,我们使用了 8.2%,这是基于 1.031 的杠杆测试值。与整个市场相比,Beta是衡量股票波动率的指标。我们的测试值来自全球可比公司的行业平均测试值,施加的限制在0.8到2.0之间,对于稳定的业务而言,这是一个合理的范围。
SWOT Analysis for Autodesk
Autodesk 的 SWOT 分析
- Earnings growth over the past year exceeded the industry.
- 过去一年的收益增长超过了该行业。
- Debt is not viewed as a risk.
- 债务不被视为风险。
- Balance sheet summary for ADSK.
- ADSK 的资产负债表摘要。
- No major weaknesses identified for ADSK.
- 未发现 ADSK 存在重大弱点。
- Annual revenue is forecast to grow faster than the American market.
- 预计年收入的增长速度将快于美国市场。
- Current share price is below our estimate of fair value.
- 目前的股价低于我们对公允价值的估计。
- Annual earnings are forecast to grow slower than the American market.
- 预计年收益的增长速度将低于美国市场。
- What else are analysts forecasting for ADSK?
- 分析师对ADSK还有什么预测?
Looking Ahead:
展望未来:
Although the valuation of a company is important, it is only one of many factors that you need to assess for a company. DCF models are not the be-all and end-all of investment valuation. Preferably you'd apply different cases and assumptions and see how they would impact the company's valuation. For instance, if the terminal value growth rate is adjusted slightly, it can dramatically alter the overall result. For Autodesk, we've compiled three additional items you should explore:
尽管公司的估值很重要,但它只是公司需要评估的众多因素之一。DCF 模型不是投资估值的万能之计。最好你应用不同的案例和假设,看看它们将如何影响公司的估值。例如,如果稍微调整终端价值增长率,则可能会极大地改变整体结果。对于 Autodesk,我们整理了另外三个你应该探索的项目:
- Financial Health: Does ADSK have a healthy balance sheet? Take a look at our free balance sheet analysis with six simple checks on key factors like leverage and risk.
- Future Earnings: How does ADSK's growth rate compare to its peers and the wider market? Dig deeper into the analyst consensus number for the upcoming years by interacting with our free analyst growth expectation chart.
- Other Solid Businesses: Low debt, high returns on equity and good past performance are fundamental to a strong business. Why not explore our interactive list of stocks with solid business fundamentals to see if there are other companies you may not have considered!
- 财务健康: ADSK 的资产负债表健康吗?看看我们的免费资产负债表分析,对杠杆率和风险等关键因素进行六次简单检查。
- 未来收益: ADSK的增长率与同行和整个市场相比如何?通过查看我们的免费分析师增长预期图表,深入了解未来几年的分析师共识数字。
- 其他稳健的业务: 低债务、高股本回报率和良好的过往表现是强劲业务的基础。为什么不浏览我们的互动式具有坚实商业基础的股票清单,看看是否还有其他公司你可能没有考虑过!
PS. The Simply Wall St app conducts a discounted cash flow valuation for every stock on the NASDAQGS every day. If you want to find the calculation for other stocks just search here.
PS。Simply Wall St应用程序每天对纳斯达克证券交易所的每只股票进行折扣现金流估值。如果您想找到其他股票的计算方法,请在此处搜索。
Have feedback on this article? Concerned about the content? Get in touch with us directly. Alternatively, email editorial-team (at) simplywallst.com.
This article by Simply Wall St is general in nature. We provide commentary based on historical data and analyst forecasts only using an unbiased methodology and our articles are not intended to be financial advice. It does not constitute a recommendation to buy or sell any stock, and does not take account of your objectives, or your financial situation. We aim to bring you long-term focused analysis driven by fundamental data. Note that our analysis may not factor in the latest price-sensitive company announcements or qualitative material. Simply Wall St has no position in any stocks mentioned.
对这篇文章有反馈吗?担心内容吗? 取得联系 直接和我们在一起。 或者,给编辑团队 (at) simplywallst.com 发送电子邮件。
Simply Wall St 的这篇文章本质上是笼统的。 我们仅使用公正的方法根据历史数据和分析师的预测提供评论,我们的文章无意作为财务建议。 它不构成买入或卖出任何股票的建议,也没有考虑您的目标或财务状况。我们的目标是为您提供由基本面数据驱动的长期重点分析。请注意,我们的分析可能不考虑最新的价格敏感公司公告或定性材料。简而言之,华尔街在上述任何股票中都没有头寸。
译文内容由第三方软件翻译。