
Those Who Invested in Lululemon Athletica (NASDAQ:LULU) Five Years Ago Are up 247%
Those Who Invested in Lululemon Athletica (NASDAQ:LULU) Five Years Ago Are up 247%
The most you can lose on any stock (assuming you don't use leverage) is 100% of your money. But when you pick a company that is really flourishing, you can make more than 100%. For example, the Lululemon Athletica Inc. (NASDAQ:LULU) share price has soared 247% in the last half decade. Most would be very happy with that. Also pleasing for shareholders was the 15% gain in the last three months.
在任何股票上(假設你不使用槓桿),你最多可能損失的就是100%的資金。但是,當你選擇一家真正蓬勃發展的公司時,你可以 使 超過 100%。例如, 露露樂蒙 Athletica Inc. 納斯達克股票代碼:LULU)股價在過去五年中飆升了247%。大多數人會對此感到非常滿意。同樣令股東高興的是過去三個月的15%漲幅。
With that in mind, it's worth seeing if the company's underlying fundamentals have been the driver of long term performance, or if there are some discrepancies.
考慮到這一點,值得一看公司的基本面是否是長期業績的驅動力,或者是否存在一些差異。
View our latest analysis for Lululemon Athletica
查看我們對 Lululemon Athletica 的最新分析
To paraphrase Benjamin Graham: Over the short term the market is a voting machine, but over the long term it's a weighing machine. One way to examine how market sentiment has changed over time is to look at the interaction between a company's share price and its earnings per share (EPS).
用本傑明·格雷厄姆的話來說:從短期來看,市場是一臺投票機器,但從長遠來看,它是一臺稱重機。研究市場情緒如何隨着時間的推移而變化的一種方法是研究公司股價與其每股收益(EPS)之間的相互作用。
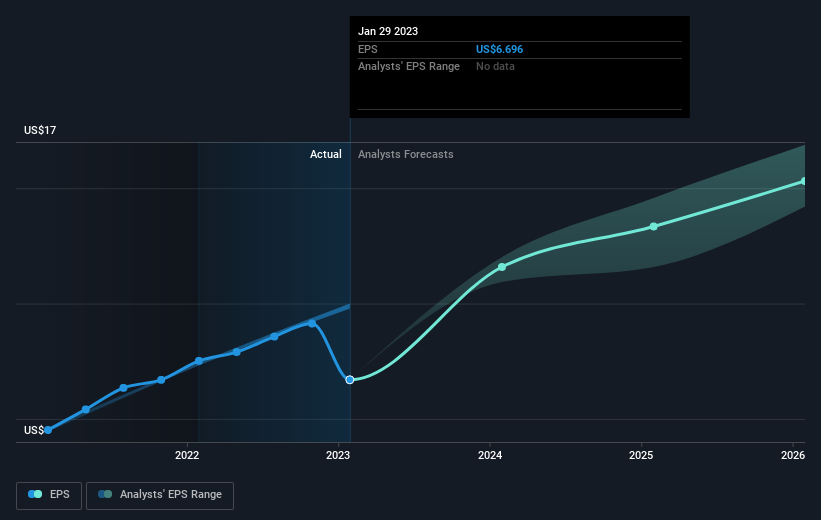
Over half a decade, Lululemon Athletica managed to grow its earnings per share at 29% a year. This EPS growth is remarkably close to the 28% average annual increase in the share price. This indicates that investor sentiment towards the company has not changed a great deal. Indeed, it would appear the share price is reacting to the EPS.
在過去的半年中,Lululemon Athletica設法將其每股收益增長到每年29%。每股收益的增長非常接近股價平均年增長28%。這表明投資者對公司的情緒沒有太大變化。事實上,看來股價正在對每股收益做出反應。
The image below shows how EPS has tracked over time (if you click on the image you can see greater detail).
下圖顯示了 EPS 在一段時間內的跟蹤情況(如果你點擊圖片,你可以看到更多細節)。
Before buying or selling a stock, we always recommend a close examination of historic growth trends, available here.
在買入或賣出股票之前,我們始終建議仔細研究歷史增長趨勢,可在此處查閱。
A Different Perspective
不同的視角
We're pleased to report that Lululemon Athletica shareholders have received a total shareholder return of 34% over one year. Since the one-year TSR is better than the five-year TSR (the latter coming in at 28% per year), it would seem that the stock's performance has improved in recent times. In the best case scenario, this may hint at some real business momentum, implying that now could be a great time to delve deeper. It's always interesting to track share price performance over the longer term. But to understand Lululemon Athletica better, we need to consider many other factors. Like risks, for instance. Every company has them, and we've spotted 2 warning signs for Lululemon Athletica (of which 1 makes us a bit uncomfortable!) you should know about.
我們很高興地向大家報告,Lululemon Athletica的股東在一年內獲得了34%的股東總回報。由於一年期股東總回報率優於五年期股東總回報率(後者爲每年28%),因此該股最近表現似乎有所改善。在最好的情況下,這可能暗示着一些真正的商業勢頭,這意味着現在可能是深入研究的好時機。從長遠來看,追蹤股價表現總是很有趣的。但是要更好地理解 Lululemon Athletica,我們需要考慮許多其他因素。比如說,比如風險。每家公司都有它們,我們已經發現了 Lululemon Athletica 有兩個警告信號 (其中 1 讓我們有點不舒服!)你應該知道。
If you are like me, then you will not want to miss this free list of growing companies that insiders are buying.
如果你和我一樣,那麼你會 不 想錯過這個 免費的 內部人士正在收購的成長型公司名單。
Please note, the market returns quoted in this article reflect the market weighted average returns of stocks that currently trade on American exchanges.
請注意,本文引用的市場回報反映了目前在美國交易所交易的股票的市場加權平均回報。
Have feedback on this article? Concerned about the content? Get in touch with us directly. Alternatively, email editorial-team (at) simplywallst.com.
This article by Simply Wall St is general in nature. We provide commentary based on historical data and analyst forecasts only using an unbiased methodology and our articles are not intended to be financial advice. It does not constitute a recommendation to buy or sell any stock, and does not take account of your objectives, or your financial situation. We aim to bring you long-term focused analysis driven by fundamental data. Note that our analysis may not factor in the latest price-sensitive company announcements or qualitative material. Simply Wall St has no position in any stocks mentioned.
對這篇文章有反饋嗎?擔心內容嗎? 取得聯繫 直接和我們在一起。 或者,給編輯團隊 (at) simplywallst.com 發送電子郵件。
Simply Wall St 的這篇文章本質上是籠統的。 我們僅使用公正的方法根據歷史數據和分析師的預測提供評論,我們的文章無意作爲財務建議。 它不構成買入或賣出任何股票的建議,也沒有考慮您的目標或財務狀況。我們的目標是爲您提供由基本面數據驅動的長期重點分析。請注意,我們的分析可能不考慮最新的價格敏感公司公告或定性材料。簡而言之,華爾街在上述任何股票中都沒有頭寸。
譯文內容由第三人軟體翻譯。