
Estimating The Fair Value Of MakeMyTrip Limited (NASDAQ:MMYT)
Estimating The Fair Value Of MakeMyTrip Limited (NASDAQ:MMYT)
Key Insights
關鍵見解
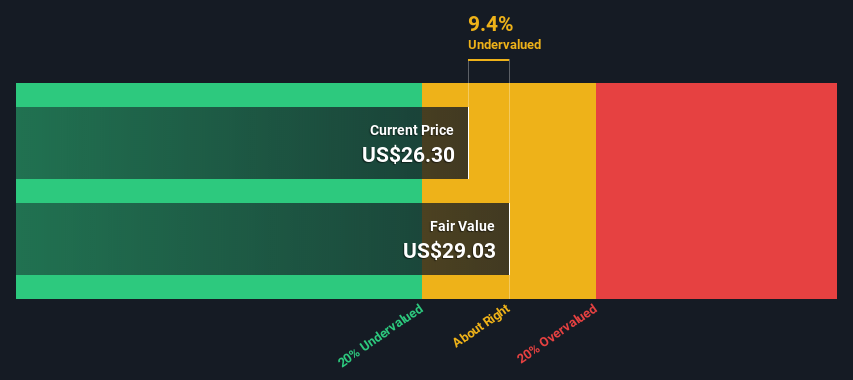
- The projected fair value for MakeMyTrip is US$29.03 based on 2 Stage Free Cash Flow to Equity
- With US$26.30 share price, MakeMyTrip appears to be trading close to its estimated fair value
- Analyst price target for MMYT is US$37.89, which is 31% above our fair value estimate
- 根據兩階段自由現金流轉股權,MakeMyTrip的預計公允價值爲29.03美元
- MakeMyTrip的股價爲26.30美元,交易價格似乎接近其估計的公允價值
- MMYT的分析師目標股價爲37.89美元,比我們的公允價值估計高出31%
Today we'll do a simple run through of a valuation method used to estimate the attractiveness of MakeMyTrip Limited (NASDAQ:MMYT) as an investment opportunity by taking the forecast future cash flows of the company and discounting them back to today's value. This will be done using the Discounted Cash Flow (DCF) model. There's really not all that much to it, even though it might appear quite complex.
今天,我們將簡單介紹一種估值方法,該估值方法用於通過計算公司預測的未來現金流並將其折現回今天的價值,來估算MakeMyTrip Limited(納斯達克股票代碼:MMYT)作爲投資機會的吸引力。這將使用貼現現金流 (DCF) 模型來完成。儘管它可能看起來很複雜,但實際上並沒有那麼多。
Companies can be valued in a lot of ways, so we would point out that a DCF is not perfect for every situation. For those who are keen learners of equity analysis, the Simply Wall St analysis model here may be something of interest to you.
公司可以在很多方面得到估值,因此我們要指出,DCF並不適合所有情況。對於那些熱衷於股票分析的人來說,你可能會對這裏的Simply Wall St分析模型感興趣。
See our latest analysis for MakeMyTrip
查看我們對 MakeMyTrip 的最新分析
Crunching The Numbers
計算數字
We use what is known as a 2-stage model, which simply means we have two different periods of growth rates for the company's cash flows. Generally the first stage is higher growth, and the second stage is a lower growth phase. To begin with, we have to get estimates of the next ten years of cash flows. Where possible we use analyst estimates, but when these aren't available we extrapolate the previous free cash flow (FCF) from the last estimate or reported value. We assume companies with shrinking free cash flow will slow their rate of shrinkage, and that companies with growing free cash flow will see their growth rate slow, over this period. We do this to reflect that growth tends to slow more in the early years than it does in later years.
我們使用所謂的兩階段模型,這僅意味着公司的現金流有兩個不同的增長期。通常,第一階段是較高的增長階段,第二階段是較低的增長階段。首先,我們必須估算出未來十年的現金流。在可能的情況下,我們會使用分析師的估計值,但是當這些估計值不可用時,我們會從最新的估計值或報告的價值中推斷出之前的自由現金流(FCF)。我們假設自由現金流萎縮的公司將減緩其萎縮速度,而自由現金流不斷增長的公司在此期間的增長率將放緩。我們這樣做是爲了反映早期增長的放緩幅度往往比後來的幾年更大。
Generally we assume that a dollar today is more valuable than a dollar in the future, and so the sum of these future cash flows is then discounted to today's value:
通常,我們假設今天的一美元比未來一美元更有價值,因此這些未來現金流的總和將折現爲今天的價值:
10-year free cash flow (FCF) estimate
10 年自由現金流 (FCF) 估計
| 2023 | 2024 | 2025 | 2026 | 2027 | 2028 | 2029 | 2030 | 2031 | 2032 | |
| Levered FCF ($, Millions) | US$48.0m | US$100.0m | US$131.5m | US$214.0m | US$281.2m | US$344.8m | US$401.6m | US$450.4m | US$491.6m | US$526.2m |
| Growth Rate Estimate Source | Analyst x2 | Analyst x1 | Analyst x2 | Analyst x1 | Est @ 31.41% | Est @ 22.62% | Est @ 16.47% | Est @ 12.16% | Est @ 9.14% | Est @ 7.03% |
| Present Value ($, Millions) Discounted @ 12% | US$42.8 | US$79.4 | US$93.0 | US$135 | US$158 | US$173 | US$179 | US$179 | US$174 | US$166 |
| 2023 | 2024 | 2025 | 2026 | 2027 | 2028 | 2029 | 2030 | 2031 | 2032 | |
| Levered FCF(美元,百萬) | 4800 萬美元 | 1.000 億美元 | 1.315 億美元 | 2.140 億美元 | 2.812 億美元 | 3.448 億美元 | 4.016 億美元 | 4.504 億美元 | 4.916 億美元 | 5.262 億美元 |
| 增長率估算來源 | 分析師 x2 | 分析師 x1 | 分析師 x2 | 分析師 x1 | 美國東部時間 @ 31.41% | 美國東部標準時間 @ 22.62% | 美國東部標準時間 @ 16.47% | Est @ 12.16% | 美國東部標準時間 @ 9.14% | 美國東部標準時間 @ 7.03% |
| 現值(美元,百萬)折扣 @ 12% | 42.8 美元 | 79.4 美元 | 93.0 美元 | 135 美元 | 158 美元 | 173 美元 | 179 美元 | 179 美元 | 174 美元 | 166 美元 |
("Est" = FCF growth rate estimated by Simply Wall St)
Present Value of 10-year Cash Flow (PVCF) = US$1.4b
(“Est” = Simply Wall St估計的FCF增長率)
10年期現金流(PVCF)的現值 = 14億美元
We now need to calculate the Terminal Value, which accounts for all the future cash flows after this ten year period. The Gordon Growth formula is used to calculate Terminal Value at a future annual growth rate equal to the 5-year average of the 10-year government bond yield of 2.1%. We discount the terminal cash flows to today's value at a cost of equity of 12%.
我們現在需要計算終端價值,它考慮了十年之後的所有未來現金流。戈登增長公式用於計算終端價值,其未來年增長率等於10年期政府債券收益率2.1%的5年平均值。我們將終端現金流折現爲今天的價值,權益成本爲12%。
Terminal Value (TV)= FCF2032 × (1 + g) ÷ (r – g) = US$526m× (1 + 2.1%) ÷ (12%– 2.1%) = US$5.3b
終端價值 (TV)= FCF2032 × (1 + g) ÷ (r — g) = 5.26億美元× (1 + 2.1%) ÷ (12% — 2.1%) = 53億美元
Present Value of Terminal Value (PVTV)= TV / (1 + r)10= US$5.3b÷ ( 1 + 12%)10= US$1.7b
終端價值的現值 (PVTV)= 電視/ (1 + r)10= 53b美元÷ (1 + 12%)10= 17億美元
The total value is the sum of cash flows for the next ten years plus the discounted terminal value, which results in the Total Equity Value, which in this case is US$3.1b. In the final step we divide the equity value by the number of shares outstanding. Compared to the current share price of US$26.3, the company appears about fair value at a 9.4% discount to where the stock price trades currently. The assumptions in any calculation have a big impact on the valuation, so it is better to view this as a rough estimate, not precise down to the last cent.
總價值是未來十年的現金流總和加上貼現的終端價值,由此得出總權益價值,在本例中爲31億美元。在最後一步中,我們將權益價值除以已發行股票的數量。與目前的26.3美元股價相比,該公司的公允價值似乎比目前的股價折扣了9.4%。任何計算中的假設都會對估值產生重大影響,因此最好將其視爲粗略的估計,而不是精確到最後一美分。
The Assumptions
假設
We would point out that the most important inputs to a discounted cash flow are the discount rate and of course the actual cash flows. If you don't agree with these result, have a go at the calculation yourself and play with the assumptions. The DCF also does not consider the possible cyclicality of an industry, or a company's future capital requirements, so it does not give a full picture of a company's potential performance. Given that we are looking at MakeMyTrip as potential shareholders, the cost of equity is used as the discount rate, rather than the cost of capital (or weighted average cost of capital, WACC) which accounts for debt. In this calculation we've used 12%, which is based on a levered beta of 1.039. Beta is a measure of a stock's volatility, compared to the market as a whole. We get our beta from the industry average beta of globally comparable companies, with an imposed limit between 0.8 and 2.0, which is a reasonable range for a stable business.
我們要指出,貼現現金流的最重要投入是貼現率,當然還有實際現金流。如果你不同意這些結果,那就自己去計算一下,試試假設。DCF也沒有考慮一個行業可能的週期性,也沒有考慮公司未來的資本需求,因此它沒有全面描述公司的潛在表現。鑑於我們將MakeMyTrip視爲潛在股東,因此使用股權成本作爲貼現率,而不是構成債務的資本成本(或加權平均資本成本,WACC)。在此計算中,我們使用了 12%,這是基於 1.039 的槓桿測試版。與整個市場相比,Beta是衡量股票波動率的指標。我們的測試值來自全球可比公司的行業平均測試值,施加的限制在0.8到2.0之間,對於穩定的業務而言,這是一個合理的範圍。
SWOT Analysis for MakeMyTrip
MakeMyTrip 的 SWOT 分析
- Cash in surplus of total debt.
- 現金盈餘佔債務總額。
- Balance sheet summary for MMYT.
- MMYT 的資產負債表摘要。
- Interest payments on debt are not well covered.
- 債務的利息支付未得到充分保障。
- Expected to breakeven next year.
- 預計明年將實現盈虧平衡。
- Has sufficient cash runway for more than 3 years based on current free cash flows.
- 根據當前的自由現金流,有足夠的現金流超過3年。
- Current share price is below our estimate of fair value.
- 目前的股價低於我們對公允價值的估計。
- Debt is not well covered by operating cash flow.
- 運營現金流無法很好地覆蓋債務。
- Is MMYT well equipped to handle threats?
- MMYT 有能力應對威脅嗎?
Next Steps:
後續步驟:
Valuation is only one side of the coin in terms of building your investment thesis, and it is only one of many factors that you need to assess for a company. DCF models are not the be-all and end-all of investment valuation. Preferably you'd apply different cases and assumptions and see how they would impact the company's valuation. If a company grows at a different rate, or if its cost of equity or risk free rate changes sharply, the output can look very different. For MakeMyTrip, we've compiled three relevant items you should consider:
就建立投資論點而言,估值只是硬幣的一面,它只是公司需要評估的衆多因素之一。DCF 模型不是投資估值的萬能之計。最好你應用不同的案例和假設,看看它們將如何影響公司的估值。如果一家公司以不同的速度增長,或者其股本成本或無風險利率發生急劇變化,則產出可能會大不相同。對於 MakeMyTrip,我們整理了三個你應該考慮的相關項目:
- Financial Health: Does MMYT have a healthy balance sheet? Take a look at our free balance sheet analysis with six simple checks on key factors like leverage and risk.
- Future Earnings: How does MMYT's growth rate compare to its peers and the wider market? Dig deeper into the analyst consensus number for the upcoming years by interacting with our free analyst growth expectation chart.
- Other Solid Businesses: Low debt, high returns on equity and good past performance are fundamental to a strong business. Why not explore our interactive list of stocks with solid business fundamentals to see if there are other companies you may not have considered!
- 財務健康: MMYT 的資產負債表健康嗎?看看我們的免費資產負債表分析,其中包含對槓桿率和風險等關鍵因素的六項簡單檢查。
- 未來收益: 與同行和整個市場相比,MMYT的增長率如何?通過與我們的免費分析師增長預期圖表互動,更深入地瞭解未來幾年的分析師共識數字。
- 其他穩健的業務: 低債務、高股本回報率和良好的過往表現是強勁業務的基礎。爲甚麼不瀏覽我們的互動式具有堅實商業基礎的股票清單,看看是否還有其他公司你可能沒有考慮過!
PS. Simply Wall St updates its DCF calculation for every American stock every day, so if you want to find the intrinsic value of any other stock just search here.
PS。Simply Wall St每天都會更新每隻美國股票的差價合約計算結果,因此,如果您想找到任何其他股票的內在價值,請在此處搜索。
Have feedback on this article? Concerned about the content? Get in touch with us directly. Alternatively, email editorial-team (at) simplywallst.com.
This article by Simply Wall St is general in nature. We provide commentary based on historical data and analyst forecasts only using an unbiased methodology and our articles are not intended to be financial advice. It does not constitute a recommendation to buy or sell any stock, and does not take account of your objectives, or your financial situation. We aim to bring you long-term focused analysis driven by fundamental data. Note that our analysis may not factor in the latest price-sensitive company announcements or qualitative material. Simply Wall St has no position in any stocks mentioned.
對這篇文章有反饋嗎?擔心內容嗎? 取得聯繫 直接和我們在一起。 或者,給編輯團隊 (at) simplywallst.com 發送電子郵件。
Simply Wall St 的這篇文章本質上是籠統的。 我們僅使用公正的方法根據歷史數據和分析師的預測提供評論,我們的文章無意作爲財務建議。 它不構成買入或賣出任何股票的建議,也沒有考慮您的目標或財務狀況。我們的目標是爲您提供由基本面數據驅動的長期重點分析。請注意,我們的分析可能不考慮最新的價格敏感公司公告或定性材料。簡而言之,華爾街在上述任何股票中都沒有頭寸。
譯文內容由第三人軟體翻譯。