
 Yahoo Finance
 Returns On Capital Signal Difficult Times Ahead For Hong Leong Asia (SGX:H22)
What financial metrics can indicate to us that a company is maturing or even in decline? Typically, we'll see the trend of both return on capital employed (ROCE) declining and this usually coincides with a decreasing amount of capital employed. This combination can tell you that not only is the company investing less, it's earning less on what it does invest. Having said that, after a brief look, Hong Leong Asia (SGX:H22) we aren't filled with optimism, but let's investigate further.
Return On Capital Employed (ROCE): What Is It?
For those who don't know, ROCE is a measure of a company's yearly pre-tax profit (its return), relative to the capital employed in the business. Analysts use this formula to calculate it for Hong Leong Asia:
Return on Capital Employed = Earnings Before Interest and Tax (EBIT) ÷ (Total Assets - Current Liabilities)
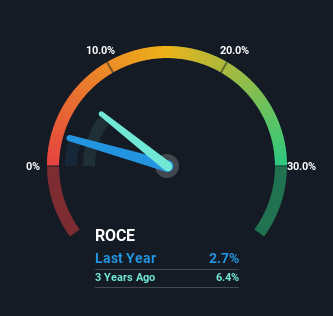
0.027 = S$74m ÷ (S$5.3b - S$2.6b) (Based on the trailing twelve months to December 2022).
Therefore, Hong Leong Asia has an ROCE of 2.7%. In absolute terms, that's a low return and it also under-performs the Machinery industry average of 6.4%.
Check out our latest analysis for Hong Leong Asia
Above you can see how the current ROCE for Hong Leong Asia compares to its prior returns on capital, but there's only so much you can tell from the past. If you'd like to see what analysts are forecasting going forward, you should check out our free report for Hong Leong Asia.
So How Is Hong Leong Asia's ROCE Trending?
There is reason to be cautious about Hong Leong Asia, given the returns are trending downwards. Unfortunately the returns on capital have diminished from the 8.3% that they were earning five years ago. Meanwhile, capital employed in the business has stayed roughly the flat over the period. Since returns are falling and the business has the same amount of assets employed, this can suggest it's a mature business that hasn't had much growth in the last five years. So because these trends aren't typically conducive to creating a multi-bagger, we wouldn't hold our breath on Hong Leong Asia becoming one if things continue as they have.
Another thing to note, Hong Leong Asia has a high ratio of current liabilities to total assets of 48%. This effectively means that suppliers (or short-term creditors) are funding a large portion of the business, so just be aware that this can introduce some elements of risk. While it's not necessarily a bad thing, it can be beneficial if this ratio is lower.
The Bottom Line
In summary, it's unfortunate that Hong Leong Asia is generating lower returns from the same amount of capital. It should come as no surprise then that the stock has fallen 26% over the last five years, so it looks like investors are recognizing these changes. That being the case, unless the underlying trends revert to a more positive trajectory, we'd consider looking elsewhere.
One more thing, we've spotted 1 warning sign facing Hong Leong Asia that you might find interesting.
For those who like to invest in solid companies, check out this free list of companies with solid balance sheets and high returns on equity.
Have feedback on this article? Concerned about the content? Get in touch with us directly. Alternatively, email editorial-team (at) simplywallst.com.
This article by Simply Wall St is general in nature. We provide commentary based on historical data and analyst forecasts only using an unbiased methodology and our articles are not intended to be financial advice. It does not constitute a recommendation to buy or sell any stock, and does not take account of your objectives, or your financial situation. We aim to bring you long-term focused analysis driven by fundamental data. Note that our analysis may not factor in the latest price-sensitive company announcements or qualitative material. Simply Wall St has no position in any stocks mentioned.
Join A Paid User Research Session
You’ll receive a US$30 Amazon Gift card for 1 hour of your time while helping us build better investing tools for the individual investors like yourself. Sign up here
