
 Yahoo Finance
 Returns On Capital At Gale Pacific (ASX:GAP) Have Stalled
What are the early trends we should look for to identify a stock that could multiply in value over the long term? In a perfect world, we'd like to see a company investing more capital into its business and ideally the returns earned from that capital are also increasing. If you see this, it typically means it's a company with a great business model and plenty of profitable reinvestment opportunities. With that in mind, the ROCE of Gale Pacific (ASX:GAP) looks decent, right now, so lets see what the trend of returns can tell us.
Return On Capital Employed (ROCE): What Is It?
For those who don't know, ROCE is a measure of a company's yearly pre-tax profit (its return), relative to the capital employed in the business. Analysts use this formula to calculate it for Gale Pacific:
Return on Capital Employed = Earnings Before Interest and Tax (EBIT) ÷ (Total Assets - Current Liabilities)
0.11 = AU$14m ÷ (AU$214m - AU$94m) (Based on the trailing twelve months to December 2022).
So, Gale Pacific has an ROCE of 11%. By itself that's a normal return on capital and it's in line with the industry's average returns of 11%.
View our latest analysis for Gale Pacific
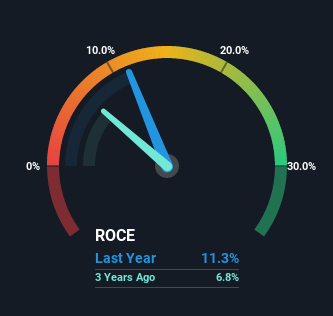
Historical performance is a great place to start when researching a stock so above you can see the gauge for Gale Pacific's ROCE against it's prior returns. If you'd like to look at how Gale Pacific has performed in the past in other metrics, you can view this free graph of past earnings, revenue and cash flow.
What Does the ROCE Trend For Gale Pacific Tell Us?
The trend of ROCE doesn't stand out much, but returns on a whole are decent. Over the past five years, ROCE has remained relatively flat at around 11% and the business has deployed 23% more capital into its operations. 11% is a pretty standard return, and it provides some comfort knowing that Gale Pacific has consistently earned this amount. Stable returns in this ballpark can be unexciting, but if they can be maintained over the long run, they often provide nice rewards to shareholders.
On another note, while the change in ROCE trend might not scream for attention, it's interesting that the current liabilities have actually gone up over the last five years. This is intriguing because if current liabilities hadn't increased to 44% of total assets, this reported ROCE would probably be less than11% because total capital employed would be higher.The 11% ROCE could be even lower if current liabilities weren't 44% of total assets, because the the formula would show a larger base of total capital employed. So with current liabilities at such high levels, this effectively means the likes of suppliers or short-term creditors are funding a meaningful part of the business, which in some instances can bring some risks.
What We Can Learn From Gale Pacific's ROCE
The main thing to remember is that Gale Pacific has proven its ability to continually reinvest at respectable rates of return. Yet over the last five years the stock has declined 13%, so the decline might provide an opening. That's why we think it'd be worthwhile to look further into this stock given the fundamentals are appealing.
One more thing to note, we've identified 2 warning signs with Gale Pacific and understanding these should be part of your investment process.
If you want to search for solid companies with great earnings, check out this free list of companies with good balance sheets and impressive returns on equity.
Have feedback on this article? Concerned about the content? Get in touch with us directly. Alternatively, email editorial-team (at) simplywallst.com.
This article by Simply Wall St is general in nature. We provide commentary based on historical data and analyst forecasts only using an unbiased methodology and our articles are not intended to be financial advice. It does not constitute a recommendation to buy or sell any stock, and does not take account of your objectives, or your financial situation. We aim to bring you long-term focused analysis driven by fundamental data. Note that our analysis may not factor in the latest price-sensitive company announcements or qualitative material. Simply Wall St has no position in any stocks mentioned.
Join A Paid User Research Session
You’ll receive a US$30 Amazon Gift card for 1 hour of your time while helping us build better investing tools for the individual investors like yourself. Sign up here
