
 Yahoo Finance
 Doctor Care Anywhere Group PLC's (ASX:DOC) Subdued P/S Might Signal An Opportunity
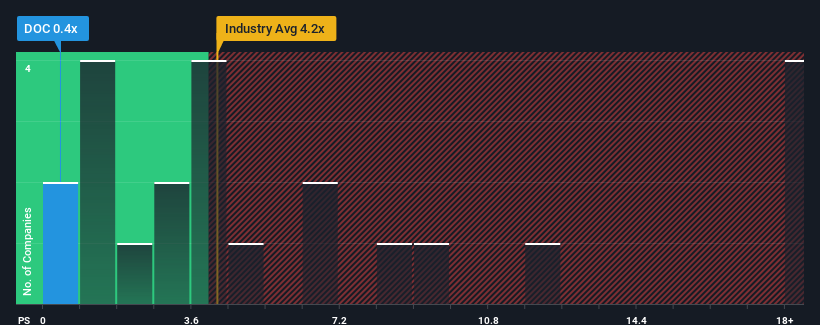
With a price-to-sales (or "P/S") ratio of 0.4x Doctor Care Anywhere Group PLC (ASX:DOC) may be sending very bullish signals at the moment, given that almost half of all the Healthcare Services companies in Australia have P/S ratios greater than 4.2x and even P/S higher than 10x are not unusual. Although, it's not wise to just take the P/S at face value as there may be an explanation why it's so limited.
Check out our latest analysis for Doctor Care Anywhere Group
How Has Doctor Care Anywhere Group Performed Recently?
Recent times haven't been great for Doctor Care Anywhere Group as its revenue has been rising slower than most other companies. Perhaps the market is expecting the current trend of poor revenue growth to continue, which has kept the P/S suppressed. If this is the case, then existing shareholders will probably struggle to get excited about the future direction of the share price.
If you'd like to see what analysts are forecasting going forward, you should check out our free report on Doctor Care Anywhere Group.
What Are Revenue Growth Metrics Telling Us About The Low P/S?
Doctor Care Anywhere Group's P/S ratio would be typical for a company that's expected to deliver very poor growth or even falling revenue, and importantly, perform much worse than the industry.
If we review the last year of revenue growth, the company posted a terrific increase of 19%. Spectacularly, three year revenue growth has ballooned by several orders of magnitude, thanks in part to the last 12 months of revenue growth. So we can start by confirming that the company has done a tremendous job of growing revenue over that time.
Looking ahead now, revenue is anticipated to climb by 37% per annum during the coming three years according to the lone analyst following the company. Meanwhile, the rest of the industry is forecast to only expand by 22% per year, which is noticeably less attractive.
With this information, we find it odd that Doctor Care Anywhere Group is trading at a P/S lower than the industry. It looks like most investors are not convinced at all that the company can achieve future growth expectations.
What Does Doctor Care Anywhere Group's P/S Mean For Investors?
While the price-to-sales ratio shouldn't be the defining factor in whether you buy a stock or not, it's quite a capable barometer of revenue expectations.
To us, it seems Doctor Care Anywhere Group currently trades on a significantly depressed P/S given its forecasted revenue growth is higher than the rest of its industry. When we see strong growth forecasts like this, we can only assume potential risks are what might be placing significant pressure on the P/S ratio. It appears the market could be anticipating revenue instability, because these conditions should normally provide a boost to the share price.
Having said that, be aware Doctor Care Anywhere Group is showing 2 warning signs in our investment analysis, and 1 of those makes us a bit uncomfortable.
Of course, profitable companies with a history of great earnings growth are generally safer bets. So you may wish to see this free collection of other companies that have reasonable P/E ratios and have grown earnings strongly.
Have feedback on this article? Concerned about the content? Get in touch with us directly. Alternatively, email editorial-team (at) simplywallst.com.
This article by Simply Wall St is general in nature. We provide commentary based on historical data and analyst forecasts only using an unbiased methodology and our articles are not intended to be financial advice. It does not constitute a recommendation to buy or sell any stock, and does not take account of your objectives, or your financial situation. We aim to bring you long-term focused analysis driven by fundamental data. Note that our analysis may not factor in the latest price-sensitive company announcements or qualitative material. Simply Wall St has no position in any stocks mentioned.
Join A Paid User Research Session
You’ll receive a US$30 Amazon Gift card for 1 hour of your time while helping us build better investing tools for the individual investors like yourself. Sign up here
