
This Foreboding Sign Looms Over Kimberly-Clark's Chart
This Foreboding Sign Looms Over Kimberly-Clark's Chart
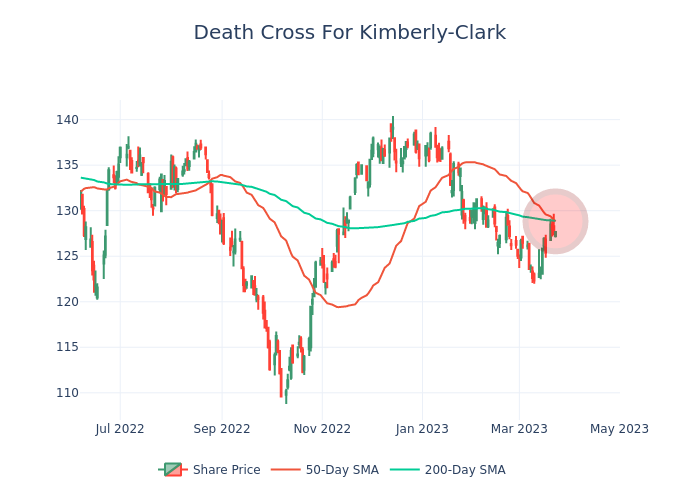
If history is any guide, there may be trouble ahead for shares of Kimberly-Clark (NYSE:KMB). A so-called "death cross" has formed on its chart and, not surprisingly, this could be bearish for the stock.
What To Know: Many traders use moving average crossover systems to make their decisions.
When a shorter-term average price crosses above a longer-term average price, it could mean the stock is trending higher. If the short-term average price crosses below the long-term average price, it means the trend is lower.
Why It's Important: The 50-day and the 200-day simple moving averages are commonly used.
The death cross occurs when the 50-day moves below the 200-day. This could mean the long-term trend is changing.
That just happened with Kimberly-Clark, which is trading around $127.66 at publication time.
Remember: Seasoned investors don't blindly trade Death Crosses.
Instead, they use it as a signal to start looking for short positions based on other factors, like price levels and company fundamentals & events.
For seasoned investors, this is just a sign that it might be time to start considering possible short positions.
With that in mind, take a look at Kimberly-Clark's past and upcoming earnings expectations:
| Quarter | Q4 2022 | Q3 2022 | Q2 2022 | Q1 2022 |
|---|---|---|---|---|
| EPS Estimate | 1.51 | 1.46 | 1.29 | 1.23 |
| EPS Actual | 1.54 | 1.40 | 1.34 | 1.35 |
| Revenue Estimate | 4.98B | 5.02B | 4.97B | 4.90B |
| Revenue Actual | 4.96B | 5.05B | 5.06B | 5.09B |
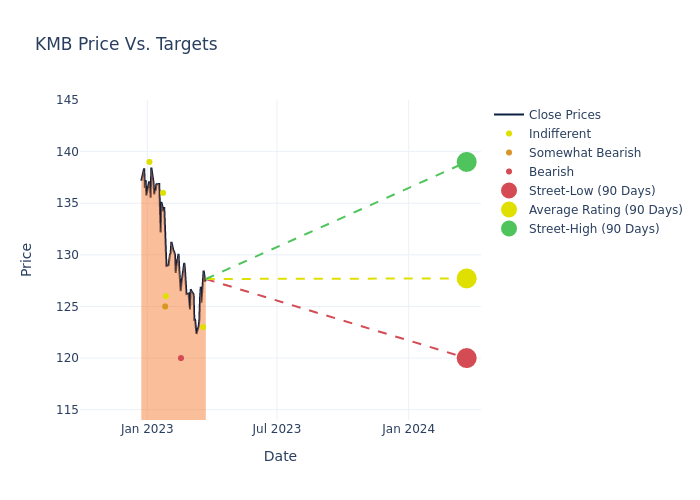
Also consider this overview of Kimberly-Clark analyst ratings:
Do you use the Death Cross signal in your trading or investing? Share this article with a friend if you found it helpful!
This article was generated by Benzinga's automated content engine and reviewed by an editor.
If history is any guide, there may be trouble ahead for shares of Kimberly-Clark (NYSE:KMB). A so-called "death cross" has formed on its chart and, not surprisingly, this could be bearish for the stock.
如果历史可以借鉴的话,苹果的股票未来可能会出现麻烦金佰利(纽约证券交易所代码:KMB)。在它的图表上已经形成了一个所谓的“死亡十字”,毫不奇怪,这可能对该股不利。
What To Know: Many traders use moving average crossover systems to make their decisions.
要知道的内容:许多交易员使用移动平均线交叉系统来做出决定。
When a shorter-term average price crosses above a longer-term average price, it could mean the stock is trending higher. If the short-term average price crosses below the long-term average price, it means the trend is lower.
当短期平均价格超过长期平均价格时,可能意味着该股正在走高。如果短期均价低于长期均价,则意味着走势更低。
Why It's Important: The 50-day and the 200-day simple moving averages are commonly used.
为什么它很重要:常用的是50日和200日简单移动均线。
The death cross occurs when the 50-day moves below the 200-day. This could mean the long-term trend is changing.
当50日线跌破200日线时,就会出现死亡十字。这可能意味着长期趋势正在改变。
That just happened with Kimberly-Clark, which is trading around $127.66 at publication time.
这种情况刚刚发生在金佰利公司身上,截至发布时,金佰利公司的股价约为127.66美元。
Remember: Seasoned investors don't blindly trade Death Crosses.
记住:经验丰富的投资者不会盲目交易死亡十字。
Instead, they use it as a signal to start looking for short positions based on other factors, like price levels and company fundamentals & events.
相反,他们把它作为一个信号,开始根据其他因素寻找空头头寸,比如价格水平和公司基本面和事件。
For seasoned investors, this is just a sign that it might be time to start considering possible short positions.
对于经验丰富的投资者来说,这只是一个迹象,表明可能是时候开始考虑可能的空头头寸了。
With that in mind, take a look at Kimberly-Clark's past and upcoming earnings expectations:
考虑到这一点,让我们来看看金佰利过去和未来的收益预期:
| Quarter | Q4 2022 | Q3 2022 | Q2 2022 | Q1 2022 |
|---|---|---|---|---|
| EPS Estimate | 1.51 | 1.46 | 1.29 | 1.23 |
| EPS Actual | 1.54 | 1.40 | 1.34 | 1.35 |
| Revenue Estimate | 4.98B | 5.02B | 4.97B | 4.90B |
| Revenue Actual | 4.96B | 5.05B | 5.06B | 5.09B |
| 季度 | 2022年第四季度 | 2022年第三季度 | 2022年第二季度 | 2022年第一季度 |
|---|---|---|---|---|
| 每股收益预估 | 1.51 | 1.46 | 1.29 | 1.23 |
| 实际每股收益 | 1.54 | 1.40 | 1.34 | 1.35 |
| 收入预估 | 4.98B | 5.02B | 4.97B | 4.90B |
| 实际收入 | 4.96B | 5.05B | 5.06B | 5.09B |
Also consider this overview of Kimberly-Clark analyst ratings:
另请考虑金佰利分析师评级概述:
Do you use the Death Cross signal in your trading or investing? Share this article with a friend if you found it helpful!
你在交易或投资中使用死亡十字信号吗?如果你觉得这篇文章对你有帮助,那就和朋友分享吧!
This article was generated by Benzinga's automated content engine and reviewed by an editor.
本文由Benzinga的自动内容引擎生成,并由编辑审阅。
译文内容由第三方软件翻译。
风险及免责提示
- 分享到weixin
- 分享到qq
- 分享到facebook
- 分享到twitter
- 分享到微博
- 粘贴板
使用浏览器的分享功能,分享给你的好友吧