Has FOS Capital Limited (ASX:FOS) Stock's Recent Performance Got Anything to Do With Its Financial Health?
FOS Capital's (ASX:FOS) stock up by 2.8% over the past week. As most would know, long-term fundamentals have a strong correlation with market price movements, so we decided to look at the company's key financial indicators today to determine if they have any role to play in the recent price movement. Specifically, we decided to study FOS Capital's ROE in this article.
Return on equity or ROE is an important factor to be considered by a shareholder because it tells them how effectively their capital is being reinvested. In short, ROE shows the profit each dollar generates with respect to its shareholder investments.
View our latest analysis for FOS Capital
How Do You Calculate Return On Equity?
The formula for return on equity is:
Return on Equity = Net Profit (from continuing operations) ÷ Shareholders' Equity
So, based on the above formula, the ROE for FOS Capital is:
5.0% = AU$454k ÷ AU$9.1m (Based on the trailing twelve months to December 2022).
The 'return' is the income the business earned over the last year. Another way to think of that is that for every A$1 worth of equity, the company was able to earn A$0.05 in profit.
What Has ROE Got To Do With Earnings Growth?
So far, we've learned that ROE is a measure of a company's profitability. Based on how much of its profits the company chooses to reinvest or "retain", we are then able to evaluate a company's future ability to generate profits. Assuming all else is equal, companies that have both a higher return on equity and higher profit retention are usually the ones that have a higher growth rate when compared to companies that don't have the same features.
FOS Capital's Earnings Growth And 5.0% ROE
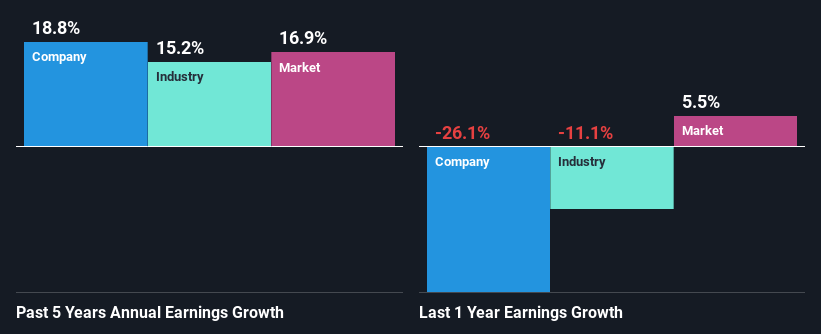
On the face of it, FOS Capital's ROE is not much to talk about. A quick further study shows that the company's ROE doesn't compare favorably to the industry average of 13% either. However, the moderate 19% net income growth seen by FOS Capital over the past five years is definitely a positive. So, there might be other aspects that are positively influencing the company's earnings growth. For example, it is possible that the company's management has made some good strategic decisions, or that the company has a low payout ratio.
Next, on comparing with the industry net income growth, we found that FOS Capital's growth is quite high when compared to the industry average growth of 15% in the same period, which is great to see.
Earnings growth is an important metric to consider when valuing a stock. What investors need to determine next is if the expected earnings growth, or the lack of it, is already built into the share price. Doing so will help them establish if the stock's future looks promising or ominous. One good indicator of expected earnings growth is the P/E ratio which determines the price the market is willing to pay for a stock based on its earnings prospects. So, you may want to check if FOS Capital is trading on a high P/E or a low P/E, relative to its industry.
Is FOS Capital Efficiently Re-investing Its Profits?
The high three-year median payout ratio of 63% (or a retention ratio of 37%) for FOS Capital suggests that the company's growth wasn't really hampered despite it returning most of its income to its shareholders.
Summary
In total, it does look like FOS Capital has some positive aspects to its business. Namely, its high earnings growth. We do however feel that the earnings growth number could have been even higher, had the company been reinvesting more of its earnings and paid out less dividends. Until now, we have only just grazed the surface of the company's past performance by looking at the company's fundamentals. You can do your own research on FOS Capital and see how it has performed in the past by looking at this FREE detailed graph of past earnings, revenue and cash flows.
Have feedback on this article? Concerned about the content? Get in touch with us directly. Alternatively, email editorial-team (at) simplywallst.com.
This article by Simply Wall St is general in nature. We provide commentary based on historical data and analyst forecasts only using an unbiased methodology and our articles are not intended to be financial advice. It does not constitute a recommendation to buy or sell any stock, and does not take account of your objectives, or your financial situation. We aim to bring you long-term focused analysis driven by fundamental data. Note that our analysis may not factor in the latest price-sensitive company announcements or qualitative material. Simply Wall St has no position in any stocks mentioned.
Join A Paid User Research Session
You’ll receive a US$30 Amazon Gift card for 1 hour of your time while helping us build better investing tools for the individual investors like yourself. Sign up here
