
A Look At The Intrinsic Value Of Lindsay Corporation (NYSE:LNN)
A Look At The Intrinsic Value Of Lindsay Corporation (NYSE:LNN)
Key Insights
关键见解
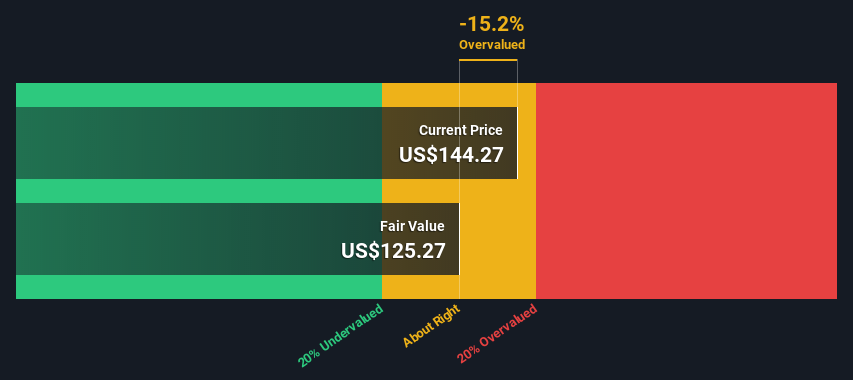
- Using the 2 Stage Free Cash Flow to Equity, Lindsay fair value estimate is US$125
- Lindsay's US$144 share price indicates it is trading at similar levels as its fair value estimate
- Analyst price target for LNN is US$187, which is 49% above our fair value estimate
- 使用两阶段自由现金流转为股权,Lindsay 的公允价值估计为 125 美元
- 林赛的144美元股价表明其交易水平与其公允价值估计值相似
- LNN的分析师目标价为187美元,比我们的公允价值估计高出49%
Does the March share price for Lindsay Corporation (NYSE:LNN) reflect what it's really worth? Today, we will estimate the stock's intrinsic value by taking the forecast future cash flows of the company and discounting them back to today's value. One way to achieve this is by employing the Discounted Cash Flow (DCF) model. Don't get put off by the jargon, the math behind it is actually quite straightforward.
林赛公司(纽约证券交易所代码:LNN)3月份的股价是否反映了它的真正价值?今天,我们将通过预测的公司未来现金流并将其折扣回今天的价值来估算股票的内在价值。实现这一目标的一种方法是采用折扣现金流 (DCF) 模型。不要被行话所推迟,它背后的数学其实很简单。
We generally believe that a company's value is the present value of all of the cash it will generate in the future. However, a DCF is just one valuation metric among many, and it is not without flaws. For those who are keen learners of equity analysis, the Simply Wall St analysis model here may be something of interest to you.
我们普遍认为,公司的价值是其未来将产生的所有现金的现值。但是,差价合约只是众多估值指标中的一个,而且并非没有缺陷。对于那些热衷于股票分析的人来说,你可能会对这里的Simply Wall St分析模型感兴趣。
See our latest analysis for Lindsay
查看我们对 Lindsay 的最新分析
The Method
该方法
We are going to use a two-stage DCF model, which, as the name states, takes into account two stages of growth. The first stage is generally a higher growth period which levels off heading towards the terminal value, captured in the second 'steady growth' period. To begin with, we have to get estimates of the next ten years of cash flows. Where possible we use analyst estimates, but when these aren't available we extrapolate the previous free cash flow (FCF) from the last estimate or reported value. We assume companies with shrinking free cash flow will slow their rate of shrinkage, and that companies with growing free cash flow will see their growth rate slow, over this period. We do this to reflect that growth tends to slow more in the early years than it does in later years.
我们将使用两阶段的DCF模型,顾名思义,该模型考虑了两个增长阶段。第一阶段通常是较高的增长期,在第二个 “稳步增长” 时期逐渐趋于平稳,最终值是第二个 “稳定增长” 时期。首先,我们必须估算出未来十年的现金流。在可能的情况下,我们会使用分析师的估计值,但是当这些估计值不可用时,我们会从最新的估计值或报告的价值中推断出之前的自由现金流(FCF)。我们假设自由现金流萎缩的公司将减缓其萎缩速度,而自由现金流不断增长的公司在此期间的增长率将放缓。我们这样做是为了反映早期增长的放缓幅度往往比后来的几年更大。
Generally we assume that a dollar today is more valuable than a dollar in the future, and so the sum of these future cash flows is then discounted to today's value:
通常,我们假设今天的一美元比未来一美元更有价值,因此这些未来现金流的总和将折现为今天的价值:
10-year free cash flow (FCF) estimate
10 年自由现金流 (FCF) 估计
| 2023 | 2024 | 2025 | 2026 | 2027 | 2028 | 2029 | 2030 | 2031 | 2032 | |
| Levered FCF ($, Millions) | US$89.2m | US$92.9m | US$85.6m | US$92.2m | US$92.9m | US$94.0m | US$95.3m | US$96.8m | US$98.5m | US$100.4m |
| Growth Rate Estimate Source | Analyst x1 | Analyst x1 | Analyst x1 | Analyst x1 | Est @ 0.75% | Est @ 1.15% | Est @ 1.42% | Est @ 1.62% | Est @ 1.75% | Est @ 1.85% |
| Present Value ($, Millions) Discounted @ 8.2% | US$82.4 | US$79.4 | US$67.6 | US$67.3 | US$62.6 | US$58.6 | US$54.9 | US$51.6 | US$48.5 | US$45.6 |
| 2023 | 2024 | 2025 | 2026 | 2027 | 2028 | 2029 | 2030 | 2031 | 2032 | |
| Levered FCF(美元,百万) | 8,920 万美元 | 9290 万美元 | 8,560 万美元 | 9,220 万美元 | 9290 万美元 | 9,400 万美元 | 9,530 万美元 | 9,680 万美元 | 9,850 万美元 | 1.004 亿美元 |
| 增长率估算来源 | 分析师 x1 | 分析师 x1 | 分析师 x1 | 分析师 x1 | Est @ 0.75% | 东部时间 @ 1.15% | Est @ 1.42% | Est @ 1.62% | Est @ 1.75% | 东部时间 @ 1.85% |
| 现值(美元,百万)折扣 @ 8.2% | 82.4 美元 | 79.4 美元 | 67.6 美元 | 67.3 美元 | 62.6 美元 | 58.6 美元 | 54.9 美元 | 51.6 美元 | 48.5 美元 | 45.6 美元 |
("Est" = FCF growth rate estimated by Simply Wall St)
Present Value of 10-year Cash Flow (PVCF) = US$618m
(“Est” = Simply Wall St估计的FCF增长率)
10年期现金流(PVCF)的现值 = 6.18 亿美元
After calculating the present value of future cash flows in the initial 10-year period, we need to calculate the Terminal Value, which accounts for all future cash flows beyond the first stage. For a number of reasons a very conservative growth rate is used that cannot exceed that of a country's GDP growth. In this case we have used the 5-year average of the 10-year government bond yield (2.1%) to estimate future growth. In the same way as with the 10-year 'growth' period, we discount future cash flows to today's value, using a cost of equity of 8.2%.
在计算了最初10年期内未来现金流的现值后,我们需要计算终端价值,该值考虑了第一阶段之后的所有未来现金流。出于多种原因,使用了非常保守的增长率,不能超过一个国家的GDP增长率。在本例中,我们使用了10年期政府债券收益率的5年平均值(2.1%)来估算未来的增长。与10年的 “增长” 期一样,我们使用8.2%的股本成本将未来的现金流折现为今天的价值。
Terminal Value (TV)= FCF2032 × (1 + g) ÷ (r – g) = US$100m× (1 + 2.1%) ÷ (8.2%– 2.1%) = US$1.7b
终端价值 (TV)= FCF2032 × (1 + g) √ (r — g) = 1亿美元× (1 + 2.1%) √ (8.2% — 2.1%) = 17亿美元
Present Value of Terminal Value (PVTV)= TV / (1 + r)10= US$1.7b÷ ( 1 + 8.2%)10= US$760m
终端价值的现值 (PVTV)= 电视/ (1 + r)10= 17亿美元≥ (1 + 8.2%)10= 7.6 亿美元
The total value, or equity value, is then the sum of the present value of the future cash flows, which in this case is US$1.4b. In the final step we divide the equity value by the number of shares outstanding. Compared to the current share price of US$144, the company appears around fair value at the time of writing. Remember though, that this is just an approximate valuation, and like any complex formula - garbage in, garbage out.
因此,总价值或权益价值是未来现金流的现值之和,在本例中为14亿美元。在最后一步中,我们将股权价值除以已发行股票的数量。与目前的144美元股价相比,该公司在撰写本文时似乎在公允价值附近。但请记住,这只是近似的估值,就像任何复杂的公式一样,垃圾进,垃圾出。
Important Assumptions
重要假设
The calculation above is very dependent on two assumptions. The first is the discount rate and the other is the cash flows. You don't have to agree with these inputs, I recommend redoing the calculations yourself and playing with them. The DCF also does not consider the possible cyclicality of an industry, or a company's future capital requirements, so it does not give a full picture of a company's potential performance. Given that we are looking at Lindsay as potential shareholders, the cost of equity is used as the discount rate, rather than the cost of capital (or weighted average cost of capital, WACC) which accounts for debt. In this calculation we've used 8.2%, which is based on a levered beta of 1.032. Beta is a measure of a stock's volatility, compared to the market as a whole. We get our beta from the industry average beta of globally comparable companies, with an imposed limit between 0.8 and 2.0, which is a reasonable range for a stable business.
上面的计算在很大程度上取决于两个假设。第一个是贴现率,另一个是现金流。你不必同意这些输入,我建议你自己重做计算然后玩一玩。DCF也没有考虑行业可能的周期性或公司未来的资本需求,因此它不能全面反映公司的潜在业绩。鉴于我们将林赛视为潜在股东,股权成本被用作贴现率,而不是考虑债务的资本成本(或加权平均资本成本,WACC)。在此计算中,我们使用了8.2%,这是基于1.032的杠杆贝塔值。Beta是衡量股票与整个市场相比的波动率的指标。我们的beta值取自全球同类公司的行业平均beta值,施加的上限在0.8到2.0之间,这对于稳定的业务来说是一个合理的区间。
SWOT Analysis for Lindsay
Lindsay 的 SWOT 分析
- Earnings growth over the past year exceeded the industry.
- 过去一年的收益增长超过了该行业。
- Debt is not viewed as a risk.
- 债务不被视为风险。
- Balance sheet summary for LNN.
- LNN 的资产负债表摘要。
- Dividend is low compared to the top 25% of dividend payers in the Machinery market.
- 与机械市场前25%的股息支付者相比,股息很低。
- Expensive based on P/E ratio and estimated fair value.
- 根据市盈率和估计的公允价值,价格昂贵。
- Annual earnings are forecast to grow for the next 3 years.
- 预计未来三年的年收入将增长。
- Dividends are not covered by cash flow.
- 现金流不涵盖股息。
- Annual earnings are forecast to grow slower than the American market.
- 预计年收益的增长速度将低于美国市场。
- See LNN's dividend history.
- 查看LNN的股息历史记录。
Looking Ahead:
展望未来:
Whilst important, the DCF calculation shouldn't be the only metric you look at when researching a company. DCF models are not the be-all and end-all of investment valuation. Preferably you'd apply different cases and assumptions and see how they would impact the company's valuation. If a company grows at a different rate, or if its cost of equity or risk free rate changes sharply, the output can look very different. For Lindsay, there are three relevant items you should further examine:
虽然很重要,但差价合约的计算不应该是你在研究公司时要考虑的唯一指标。差价合约模型不是投资估值的万能工具。最好应用不同的案例和假设,看看它们会如何影响公司的估值。如果一家公司的增长速度不同,或者其股本成本或无风险利率急剧变化,则产出可能会大不相同。对于 Lindsay 来说,你应该进一步研究三个相关项目:
- Financial Health: Does LNN have a healthy balance sheet? Take a look at our free balance sheet analysis with six simple checks on key factors like leverage and risk.
- Future Earnings: How does LNN's growth rate compare to its peers and the wider market? Dig deeper into the analyst consensus number for the upcoming years by interacting with our free analyst growth expectation chart.
- Other High Quality Alternatives: Do you like a good all-rounder? Explore our interactive list of high quality stocks to get an idea of what else is out there you may be missing!
- 财务健康: LNN 的资产负债表健康吗?看看我们的免费资产负债表分析,对杠杆率和风险等关键因素进行六次简单检查。
- 未来收益: 与同行和整个市场相比,LNN的增长率如何?通过查看我们的免费分析师增长预期图表,深入了解未来几年的分析师共识数字。
- 其他高质量的替代品: 你喜欢一个优秀的全能选手吗?浏览我们的高品质股票互动清单,了解您可能还缺少什么!
PS. The Simply Wall St app conducts a discounted cash flow valuation for every stock on the NYSE every day. If you want to find the calculation for other stocks just search here.
PS。Simply Wall St应用程序每天对纽约证券交易所的每只股票进行折扣现金流估值。如果您想找到其他股票的计算方法,请在此处搜索。
Have feedback on this article? Concerned about the content? Get in touch with us directly. Alternatively, email editorial-team (at) simplywallst.com.
This article by Simply Wall St is general in nature. We provide commentary based on historical data and analyst forecasts only using an unbiased methodology and our articles are not intended to be financial advice. It does not constitute a recommendation to buy or sell any stock, and does not take account of your objectives, or your financial situation. We aim to bring you long-term focused analysis driven by fundamental data. Note that our analysis may not factor in the latest price-sensitive company announcements or qualitative material. Simply Wall St has no position in any stocks mentioned.
对这篇文章有反馈吗?担心内容吗? 取得联系 直接和我们在一起。 或者,给编辑团队 (at) simplywallst.com 发送电子邮件。
Simply Wall St 的这篇文章本质上是笼统的。 我们仅使用公正的方法根据历史数据和分析师的预测提供评论,我们的文章无意作为财务建议。 它不构成买入或卖出任何股票的建议,也没有考虑您的目标或财务状况。我们的目标是为您提供由基本面数据驱动的长期重点分析。请注意,我们的分析可能不考虑最新的价格敏感公司公告或定性材料。简而言之,华尔街在上述任何股票中都没有头寸。
译文内容由第三方软件翻译。