
 Yahoo Finance
 Is Weakness In XTEK Limited (ASX:XTE) Stock A Sign That The Market Could be Wrong Given Its Strong Financial Prospects?
With its stock down 33% over the past week, it is easy to disregard XTEK (ASX:XTE). However, stock prices are usually driven by a company’s financial performance over the long term, which in this case looks quite promising. In this article, we decided to focus on XTEK's ROE.
Return on equity or ROE is a key measure used to assess how efficiently a company's management is utilizing the company's capital. Put another way, it reveals the company's success at turning shareholder investments into profits.
View our latest analysis for XTEK
How Do You Calculate Return On Equity?
Return on equity can be calculated by using the formula:
Return on Equity = Net Profit (from continuing operations) ÷ Shareholders' Equity
So, based on the above formula, the ROE for XTEK is:
45% = AU$19m ÷ AU$41m (Based on the trailing twelve months to December 2022).
The 'return' is the yearly profit. That means that for every A$1 worth of shareholders' equity, the company generated A$0.45 in profit.
What Is The Relationship Between ROE And Earnings Growth?
We have already established that ROE serves as an efficient profit-generating gauge for a company's future earnings. Depending on how much of these profits the company reinvests or "retains", and how effectively it does so, we are then able to assess a company’s earnings growth potential. Assuming everything else remains unchanged, the higher the ROE and profit retention, the higher the growth rate of a company compared to companies that don't necessarily bear these characteristics.
XTEK's Earnings Growth And 45% ROE
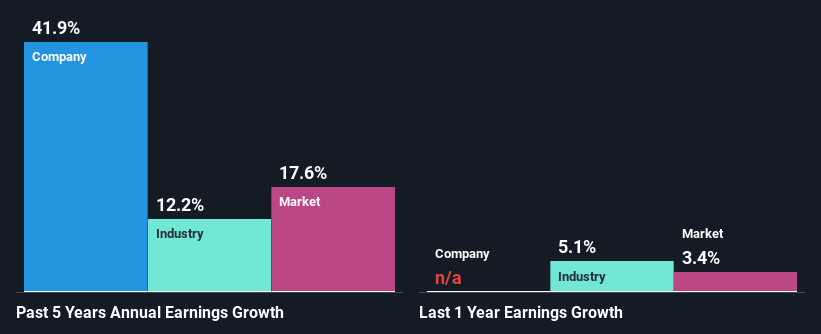
Firstly, we acknowledge that XTEK has a significantly high ROE. Additionally, the company's ROE is higher compared to the industry average of 8.9% which is quite remarkable. Under the circumstances, XTEK's considerable five year net income growth of 42% was to be expected.
Next, on comparing XTEK's net income growth with the industry, we found that the company's reported growth is similar to the industry average growth rate of 36% in the same period.
The basis for attaching value to a company is, to a great extent, tied to its earnings growth. It’s important for an investor to know whether the market has priced in the company's expected earnings growth (or decline). Doing so will help them establish if the stock's future looks promising or ominous. Has the market priced in the future outlook for XTE? You can find out in our latest intrinsic value infographic research report
Is XTEK Making Efficient Use Of Its Profits?
Given that XTEK doesn't pay any dividend to its shareholders, we infer that the company has been reinvesting all of its profits to grow its business.
Summary
On the whole, we feel that XTEK's performance has been quite good. Specifically, we like that the company is reinvesting a huge chunk of its profits at a high rate of return. This of course has caused the company to see substantial growth in its earnings. That being so, according to the latest industry analyst forecasts, the company's earnings are expected to shrink in the future. To know more about the company's future earnings growth forecasts take a look at this free report on analyst forecasts for the company to find out more.
Have feedback on this article? Concerned about the content? Get in touch with us directly. Alternatively, email editorial-team (at) simplywallst.com.
This article by Simply Wall St is general in nature. We provide commentary based on historical data and analyst forecasts only using an unbiased methodology and our articles are not intended to be financial advice. It does not constitute a recommendation to buy or sell any stock, and does not take account of your objectives, or your financial situation. We aim to bring you long-term focused analysis driven by fundamental data. Note that our analysis may not factor in the latest price-sensitive company announcements or qualitative material. Simply Wall St has no position in any stocks mentioned.
Join A Paid User Research Session
You’ll receive a US$30 Amazon Gift card for 1 hour of your time while helping us build better investing tools for the individual investors like yourself. Sign up here
