
An Intrinsic Calculation For Uber Technologies, Inc. (NYSE:UBER) Suggests It's 49% Undervalued
An Intrinsic Calculation For Uber Technologies, Inc. (NYSE:UBER) Suggests It's 49% Undervalued
Today we'll do a simple run through of a valuation method used to estimate the attractiveness of Uber Technologies, Inc. (NYSE:UBER) as an investment opportunity by projecting its future cash flows and then discounting them to today's value. Our analysis will employ the Discounted Cash Flow (DCF) model. There's really not all that much to it, even though it might appear quite complex.
今天,我们将简单介绍一种估值方法,该方法用于预测优步技术公司(纽约证券交易所代码:UBER)作为投资机会的吸引力,方法是预测其未来现金流,然后将其折现为今天的价值。我们的分析将采用贴现现金流(DCF)模型。它真的没有那么多东西,尽管它可能看起来相当复杂。
Remember though, that there are many ways to estimate a company's value, and a DCF is just one method. For those who are keen learners of equity analysis, the Simply Wall St analysis model here may be something of interest to you.
不过请记住,有很多方法可以评估一家公司的价值,贴现现金流只是其中一种方法。对于那些热衷于学习股票分析的人来说,这里的Simply Wall St.分析模型可能会让你感兴趣。
See our latest analysis for Uber Technologies
查看我们对优步技术的最新分析
The Model
模型
We are going to use a two-stage DCF model, which, as the name states, takes into account two stages of growth. The first stage is generally a higher growth period which levels off heading towards the terminal value, captured in the second 'steady growth' period. To start off with, we need to estimate the next ten years of cash flows. Where possible we use analyst estimates, but when these aren't available we extrapolate the previous free cash flow (FCF) from the last estimate or reported value. We assume companies with shrinking free cash flow will slow their rate of shrinkage, and that companies with growing free cash flow will see their growth rate slow, over this period. We do this to reflect that growth tends to slow more in the early years than it does in later years.
我们将使用两阶段贴现现金流模型,顾名思义,该模型考虑了两个增长阶段。第一阶段通常是一个较高的成长期,接近终值,在第二个“稳定增长”阶段捕捉到。首先,我们需要估计未来十年的现金流。在可能的情况下,我们使用分析师的估计,但当这些估计不可用时,我们会根据上次估计或报告的价值推断先前的自由现金流(FCF)。我们假设,自由现金流萎缩的公司将减缓收缩速度,而自由现金流增长的公司在这段时间内的增长速度将放缓。我们这样做是为了反映出,增长在最初几年往往比后来几年放缓得更多。
Generally we assume that a dollar today is more valuable than a dollar in the future, so we need to discount the sum of these future cash flows to arrive at a present value estimate:
一般来说,我们假设今天的一美元比未来的一美元更有价值,因此我们需要对这些未来现金流的总和进行贴现,以得出现值估计:
10-year free cash flow (FCF) forecast
10年自由现金流(FCF)预测
| 2023 | 2024 | 2025 | 2026 | 2027 | 2028 | 2029 | 2030 | 2031 | 2032 | |
| Levered FCF ($, Millions) | US$2.47b | US$4.16b | US$5.29b | US$6.16b | US$7.60b | US$8.68b | US$9.59b | US$10.4b | US$11.0b | US$11.5b |
| Growth Rate Estimate Source | Analyst x14 | Analyst x11 | Analyst x6 | Analyst x6 | Analyst x5 | Est @ 14.13% | Est @ 10.51% | Est @ 7.98% | Est @ 6.21% | Est @ 4.96% |
| Present Value ($, Millions) Discounted @ 8.2% | US$2.3k | US$3.6k | US$4.2k | US$4.5k | US$5.1k | US$5.4k | US$5.5k | US$5.5k | US$5.4k | US$5.2k |
| 2023 | 2024 | 2025 | 2026 | 2027 | 2028 | 2029 | 2030 | 2031 | 2032 | |
| 杠杆式FCF(百万美元) | 24.7亿美元 | 41.6亿美元 | 52.9亿美元 | 61.6亿美元 | 76亿美元 | 86.8亿美元 | 95.9亿美元 | 104亿美元 | 110亿美元 | 115亿美元 |
| 增长率预估来源 | 分析师x14 | 分析师x11 | 分析师x6 | 分析师x6 | 分析师X5 | Est@14.13% | Est@10.51% | Est@7.98% | Est@6.21% | Est@4.96% |
| 现值(美元,百万)贴现@8.2% | 230万美元 | 360万美元 | 420万美元 | 450万美元 | 510万美元 | 540万美元 | 55万美元 | 55万美元 | 540万美元 | 520万美元 |
("Est" = FCF growth rate estimated by Simply Wall St)
Present Value of 10-year Cash Flow (PVCF) = US$47b
(“EST”=Simply Wall St.预估的FCF成长率)
10年期现金流现值(PVCF)=470亿美元
The second stage is also known as Terminal Value, this is the business's cash flow after the first stage. For a number of reasons a very conservative growth rate is used that cannot exceed that of a country's GDP growth. In this case we have used the 5-year average of the 10-year government bond yield (2.1%) to estimate future growth. In the same way as with the 10-year 'growth' period, we discount future cash flows to today's value, using a cost of equity of 8.2%.
第二阶段也被称为终端价值,这是企业在第一阶段之后的现金流。出于一些原因,使用了一个非常保守的增长率,不能超过一个国家的国内生产总值增长率。在这种情况下,我们使用了10年期政府债券收益率的5年平均值(2.1%)来估计未来的增长。与10年“增长”期一样,我们使用8.2%的权益成本将未来现金流贴现至当前价值。
Terminal Value (TV)= FCF2032 × (1 + g) ÷ (r – g) = US$12b× (1 + 2.1%) ÷ (8.2%– 2.1%) = US$192b
终端值(TV)=FCF2032×(1+g)?(r-g)=120亿美元×(1+2.1%)?(8.2%-2.1%)=192亿美元
Present Value of Terminal Value (PVTV)= TV / (1 + r)10= US$192b÷ ( 1 + 8.2%)10= US$87b
终值现值(PVTV)=TV/(1+r)10=1,920亿美元?(1+8.2%)10=870亿美元
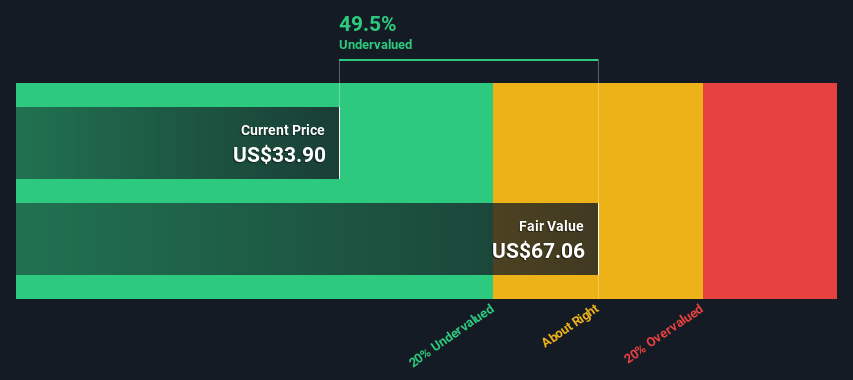
The total value is the sum of cash flows for the next ten years plus the discounted terminal value, which results in the Total Equity Value, which in this case is US$134b. In the final step we divide the equity value by the number of shares outstanding. Relative to the current share price of US$33.9, the company appears quite undervalued at a 49% discount to where the stock price trades currently. Valuations are imprecise instruments though, rather like a telescope - move a few degrees and end up in a different galaxy. Do keep this in mind.
总价值是未来十年的现金流总和加上贴现的终端价值,得出总股权价值,在本例中为1340亿美元。在最后一步,我们用股本价值除以流通股的数量。相对于目前33.9美元的股价,该公司的估值似乎比目前的股价有49%的折让。然而,估值是不精确的工具,更像是一台望远镜--移动几度,就会到达另一个星系。一定要记住这一点。
The Assumptions
假设
The calculation above is very dependent on two assumptions. The first is the discount rate and the other is the cash flows. You don't have to agree with these inputs, I recommend redoing the calculations yourself and playing with them. The DCF also does not consider the possible cyclicality of an industry, or a company's future capital requirements, so it does not give a full picture of a company's potential performance. Given that we are looking at Uber Technologies as potential shareholders, the cost of equity is used as the discount rate, rather than the cost of capital (or weighted average cost of capital, WACC) which accounts for debt. In this calculation we've used 8.2%, which is based on a levered beta of 1.035. Beta is a measure of a stock's volatility, compared to the market as a whole. We get our beta from the industry average beta of globally comparable companies, with an imposed limit between 0.8 and 2.0, which is a reasonable range for a stable business.
上述计算在很大程度上取决于两个假设。第一个是贴现率,另一个是现金流。您不必同意这些输入,我建议您自己重新计算并使用它们。DCF也没有考虑一个行业可能的周期性,也没有考虑一家公司未来的资本要求,因此它没有给出一家公司潜在业绩的全貌。鉴于我们将优步技术视为潜在股东,股权成本被用作贴现率,而不是占债务的资本成本(或加权平均资本成本,WACC)。在这个计算中,我们使用了8.2%,这是基于杠杆率为1.035的测试值。贝塔系数是衡量一只股票相对于整个市场的波动性的指标。我们的贝塔系数来自全球可比公司的行业平均贝塔系数,强制限制在0.8到2.0之间,这是一个稳定业务的合理范围。
SWOT Analysis for Uber Technologies
优步技术的SWOT分析
- No major strengths identified for UBER.
- 没有发现优步的主要优势。
- Shareholders have been diluted in the past year.
- 在过去的一年里,股东被稀释了。
- Forecast to reduce losses next year.
- 预计明年将减少亏损。
- Has sufficient cash runway for more than 3 years based on current free cash flows.
- 根据目前的自由现金流,拥有足够的现金跑道超过3年。
- Trading below our estimate of fair value by more than 20%.
- 交易价格比我们估计的公允价值低20%以上。
- Have UBER insiders been buying lately?
- 优步内部人士最近一直在买入吗?
- Debt is not well covered by operating cash flow.
- 运营现金流无法很好地覆盖债务。
- Is UBER well equipped to handle threats?
- 优步是否做好了应对威胁的准备?
Moving On:
下一步:
Whilst important, the DCF calculation is only one of many factors that you need to assess for a company. DCF models are not the be-all and end-all of investment valuation. Rather it should be seen as a guide to "what assumptions need to be true for this stock to be under/overvalued?" For instance, if the terminal value growth rate is adjusted slightly, it can dramatically alter the overall result. Can we work out why the company is trading at a discount to intrinsic value? For Uber Technologies, we've compiled three additional items you should look at:
虽然贴现现金流的计算很重要,但它只是一家公司需要评估的众多因素之一。贴现现金流模型并不是投资估值的全部。相反,它应该被视为“什么假设需要成立才能让这只股票被低估或高估”的指南。例如,如果终端价值增长率稍有调整,可能会极大地改变整体结果。我们能弄清楚为什么该公司的股价低于内在价值吗?对于Uber Technologies,我们为你整理了三个额外的条目,你应该看看:
- Risks: Take risks, for example - Uber Technologies has 2 warning signs we think you should be aware of.
- Future Earnings: How does UBER's growth rate compare to its peers and the wider market? Dig deeper into the analyst consensus number for the upcoming years by interacting with our free analyst growth expectation chart.
- Other High Quality Alternatives: Do you like a good all-rounder? Explore our interactive list of high quality stocks to get an idea of what else is out there you may be missing!
- 风险:例如,承担风险-优步技术公司2个警告标志我们认为你应该意识到。
- 未来收益:与同行和更广泛的市场相比,优步的增长速度如何?通过与我们的免费分析师增长预期图表互动,更深入地挖掘分析师对未来几年的共识数字。
- 其他高质量替代产品:你喜欢一个好的全能运动员吗?浏览我们的高质量股票互动列表,了解您可能会错过的其他股票!
PS. The Simply Wall St app conducts a discounted cash flow valuation for every stock on the NYSE every day. If you want to find the calculation for other stocks just search here.
PS.Simply Wall St.应用每天对纽约证交所的每只股票进行现金流贴现估值。如果你想找到其他股票的计算方法,只需搜索此处。
Have feedback on this article? Concerned about the content? Get in touch with us directly. Alternatively, email editorial-team (at) simplywallst.com.
This article by Simply Wall St is general in nature. We provide commentary based on historical data and analyst forecasts only using an unbiased methodology and our articles are not intended to be financial advice. It does not constitute a recommendation to buy or sell any stock, and does not take account of your objectives, or your financial situation. We aim to bring you long-term focused analysis driven by fundamental data. Note that our analysis may not factor in the latest price-sensitive company announcements or qualitative material. Simply Wall St has no position in any stocks mentioned.
对这篇文章有什么反馈吗?担心内容吗? 保持联系直接与我们联系。或者,也可以给编辑组发电子邮件,地址是implywallst.com。
本文由Simply Wall St.撰写,具有概括性。我们仅使用不偏不倚的方法提供基于历史数据和分析师预测的评论,我们的文章并不打算作为财务建议。它不构成买卖任何股票的建议,也没有考虑你的目标或你的财务状况。我们的目标是为您带来由基本面数据驱动的长期重点分析。请注意,我们的分析可能不会将最新的对价格敏感的公司公告或定性材料考虑在内。Simply Wall St.对上述任何一只股票都没有持仓。
译文内容由第三方软件翻译。