After losing 11% in the past year, Intuitive Surgical, Inc. (NASDAQ:ISRG) institutional owners must be relieved by the recent gain
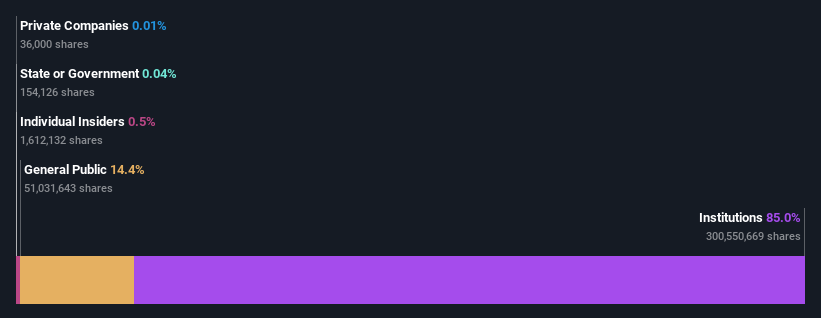
Every investor in Intuitive Surgical, Inc. (NASDAQ:ISRG) should be aware of the most powerful shareholder groups. And the group that holds the biggest piece of the pie are institutions with 85% ownership. In other words, the group stands to gain the most (or lose the most) from their investment into the company.
Last week's US$2.6b market cap gain would probably be appreciated by institutional investors, especially after a year of 11% losses.
In the chart below, we zoom in on the different ownership groups of Intuitive Surgical.
See our latest analysis for Intuitive Surgical
What Does The Institutional Ownership Tell Us About Intuitive Surgical?
Institutional investors commonly compare their own returns to the returns of a commonly followed index. So they generally do consider buying larger companies that are included in the relevant benchmark index.
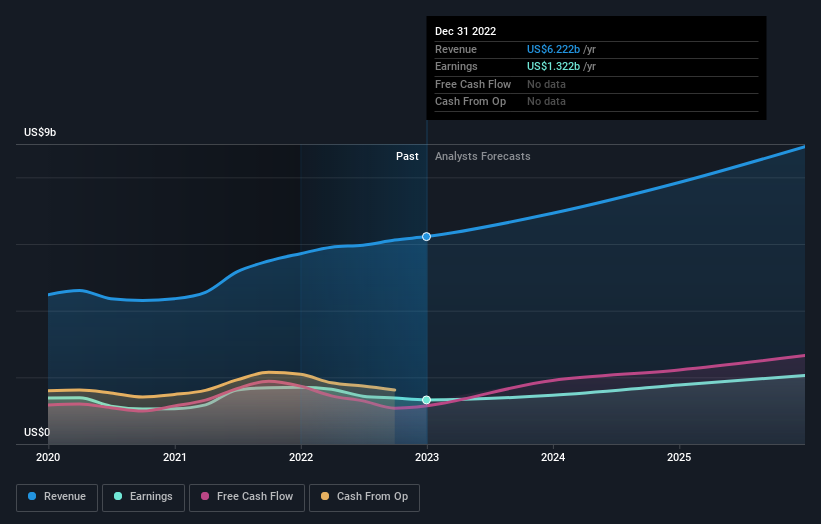
We can see that Intuitive Surgical does have institutional investors; and they hold a good portion of the company's stock. This suggests some credibility amongst professional investors. But we can't rely on that fact alone since institutions make bad investments sometimes, just like everyone does. It is not uncommon to see a big share price drop if two large institutional investors try to sell out of a stock at the same time. So it is worth checking the past earnings trajectory of Intuitive Surgical, (below). Of course, keep in mind that there are other factors to consider, too.
Since institutional investors own more than half the issued stock, the board will likely have to pay attention to their preferences. We note that hedge funds don't have a meaningful investment in Intuitive Surgical. Looking at our data, we can see that the largest shareholder is The Vanguard Group, Inc. with 8.3% of shares outstanding. Meanwhile, the second and third largest shareholders, hold 7.9% and 6.9%, of the shares outstanding, respectively.
After doing some more digging, we found that the top 22 have the combined ownership of 50% in the company, suggesting that no single shareholder has significant control over the company.
While it makes sense to study institutional ownership data for a company, it also makes sense to study analyst sentiments to know which way the wind is blowing. There are plenty of analysts covering the stock, so it might be worth seeing what they are forecasting, too.
Insider Ownership Of Intuitive Surgical
While the precise definition of an insider can be subjective, almost everyone considers board members to be insiders. Company management run the business, but the CEO will answer to the board, even if he or she is a member of it.
Insider ownership is positive when it signals leadership are thinking like the true owners of the company. However, high insider ownership can also give immense power to a small group within the company. This can be negative in some circumstances.
Our data suggests that insiders own under 1% of Intuitive Surgical, Inc. in their own names. As it is a large company, we'd only expect insiders to own a small percentage of it. But it's worth noting that they own US$411m worth of shares. It is always good to see at least some insider ownership, but it might be worth checking if those insiders have been selling.
General Public Ownership
The general public, who are usually individual investors, hold a 14% stake in Intuitive Surgical. This size of ownership, while considerable, may not be enough to change company policy if the decision is not in sync with other large shareholders.
Next Steps:
While it is well worth considering the different groups that own a company, there are other factors that are even more important.
I always like to check for a history of revenue growth. You can too, by accessing this free chart of historic revenue and earnings in this detailed graph.
If you would prefer discover what analysts are predicting in terms of future growth, do not miss this free report on analyst forecasts.
NB: Figures in this article are calculated using data from the last twelve months, which refer to the 12-month period ending on the last date of the month the financial statement is dated. This may not be consistent with full year annual report figures.
Have feedback on this article? Concerned about the content? Get in touch with us directly. Alternatively, email editorial-team (at) simplywallst.com.
This article by Simply Wall St is general in nature. We provide commentary based on historical data and analyst forecasts only using an unbiased methodology and our articles are not intended to be financial advice. It does not constitute a recommendation to buy or sell any stock, and does not take account of your objectives, or your financial situation. We aim to bring you long-term focused analysis driven by fundamental data. Note that our analysis may not factor in the latest price-sensitive company announcements or qualitative material. Simply Wall St has no position in any stocks mentioned.
Join A Paid User Research Session
You’ll receive a US$30 Amazon Gift card for 1 hour of your time while helping us build better investing tools for the individual investors like yourself. Sign up here
