
Tianjin Pharmaceutical Da Ren Tang Group (SGX:T14) Jumps 8.3% This Week, Though Earnings Growth Is Still Tracking Behind Three-year Shareholder Returns
Tianjin Pharmaceutical Da Ren Tang Group (SGX:T14) Jumps 8.3% This Week, Though Earnings Growth Is Still Tracking Behind Three-year Shareholder Returns
By buying an index fund, you can roughly match the market return with ease. But if you choose individual stocks with prowess, you can make superior returns. For example, Tianjin Pharmaceutical Da Ren Tang Group Corporation Limited (SGX:T14) shareholders have seen the share price rise 44% over three years, well in excess of the market decline (7.6%, not including dividends). However, more recent returns haven't been as impressive as that, with the stock returning just 14% in the last year , including dividends .
通过购买指数基金,您可以轻松地与市场回报率大致相当。但是,如果你选择实力雄厚的个股,你可以获得丰厚的回报。例如, 天津药业大仁堂集团股份有限公司 (SGX: T14) 股东的股价在三年内上涨了44%,远远超过了市场的跌幅(7.6%,不包括股息)。但是,最近的回报并没有那么令人印象深刻,该股去年的回报率仅为14%,包括股息。
Since it's been a strong week for Tianjin Pharmaceutical Da Ren Tang Group shareholders, let's have a look at trend of the longer term fundamentals.
由于对于天津药业大仁堂集团的股东来说,这是强劲的一周,让我们来看看长期基本面的趋势。
Check out our latest analysis for Tianjin Pharmaceutical Da Ren Tang Group
查看我们对天津药业大仁堂集团的最新分析
To quote Buffett, 'Ships will sail around the world but the Flat Earth Society will flourish. There will continue to be wide discrepancies between price and value in the marketplace...' One flawed but reasonable way to assess how sentiment around a company has changed is to compare the earnings per share (EPS) with the share price.
引用巴菲特的话说:“船只将在世界各地航行,但Flat Earth Society将蓬勃发展。市场上的价格和价值之间将继续存在巨大差异...”评估公司情绪变化的一种有缺陷但合理的方法是将每股收益(EPS)与股价进行比较。
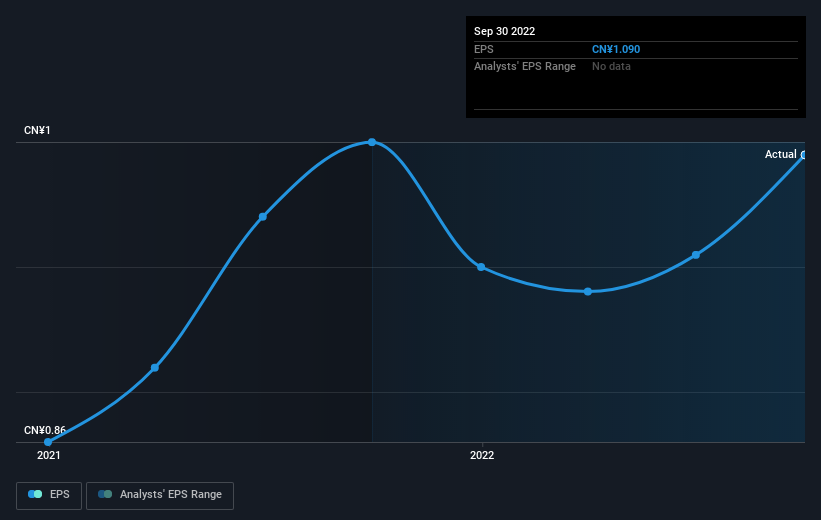
During three years of share price growth, Tianjin Pharmaceutical Da Ren Tang Group achieved compound earnings per share growth of 11% per year. We don't think it is entirely coincidental that the EPS growth is reasonably close to the 13% average annual increase in the share price. This suggests that sentiment and expectations have not changed drastically. Quite to the contrary, the share price has arguably reflected the EPS growth.
在三年的股价增长中,天津药业大仁堂集团实现了每年11%的复合每股收益增长。我们认为,每股收益增长相当接近股价平均年增长13%,这并不完全是巧合。这表明情绪和预期并未发生重大变化。恰恰相反,股价可以说反映了每股收益的增长。
The company's earnings per share (over time) is depicted in the image below (click to see the exact numbers).
该公司的每股收益(随着时间的推移)如下图所示(点击查看确切数字)。
Dive deeper into Tianjin Pharmaceutical Da Ren Tang Group's key metrics by checking this interactive graph of Tianjin Pharmaceutical Da Ren Tang Group's earnings, revenue and cash flow.
查看这张天津药业大仁堂集团收益、收入和现金流的互动图表,深入了解天津药业达仁堂集团的关键指标。
What About Dividends?
那股息呢?
It is important to consider the total shareholder return, as well as the share price return, for any given stock. Whereas the share price return only reflects the change in the share price, the TSR includes the value of dividends (assuming they were reinvested) and the benefit of any discounted capital raising or spin-off. Arguably, the TSR gives a more comprehensive picture of the return generated by a stock. We note that for Tianjin Pharmaceutical Da Ren Tang Group the TSR over the last 3 years was 71%, which is better than the share price return mentioned above. The dividends paid by the company have thusly boosted the total shareholder return.
重要的是要考虑任何给定股票的股东总回报以及股价回报率。股价回报仅反映股价的变化,而股东总回报率包括股息的价值(假设股息是再投资的)以及任何折扣融资或分拆的收益。可以说,TSR更全面地描述了股票产生的回报。我们注意到,天津药业大仁堂集团过去3年的股东总回报率为71%,好于上述股价回报率。因此,该公司支付的股息提高了 总 股东回报。
A Different Perspective
不同的视角
It's nice to see that Tianjin Pharmaceutical Da Ren Tang Group shareholders have received a total shareholder return of 14% over the last year. Of course, that includes the dividend. That gain is better than the annual TSR over five years, which is 9%. Therefore it seems like sentiment around the company has been positive lately. Someone with an optimistic perspective could view the recent improvement in TSR as indicating that the business itself is getting better with time. It's always interesting to track share price performance over the longer term. But to understand Tianjin Pharmaceutical Da Ren Tang Group better, we need to consider many other factors. To that end, you should be aware of the 1 warning sign we've spotted with Tianjin Pharmaceutical Da Ren Tang Group .
很高兴看到天津药业大仁堂集团的股东在去年获得了14%的股东总回报。当然,这包括分红。这一增幅比五年内的年度股东总回报率(9%)要好。因此,最近公司周围的情绪似乎一直很乐观。持乐观态度的人可以将最近TSR的改善视为业务本身随着时间的推移而变得越来越好。长期跟踪股价表现总是很有趣。但是,要更好地了解天津药业大仁堂集团,我们需要考虑许多其他因素。为此,你应该意识到 1 个警告标志 我们发现了天津药业大仁堂集团。
If you like to buy stocks alongside management, then you might just love this free list of companies. (Hint: insiders have been buying them).
如果你想与管理层一起买入股票,那么你可能会喜欢这个 免费的 公司名单。(提示:内部人士一直在购买它们)。
Please note, the market returns quoted in this article reflect the market weighted average returns of stocks that currently trade on SG exchanges.
请注意,本文引用的市场回报反映了目前在新加坡交易所交易的股票的市场加权平均回报。
Have feedback on this article? Concerned about the content? Get in touch with us directly. Alternatively, email editorial-team (at) simplywallst.com.
This article by Simply Wall St is general in nature. We provide commentary based on historical data and analyst forecasts only using an unbiased methodology and our articles are not intended to be financial advice. It does not constitute a recommendation to buy or sell any stock, and does not take account of your objectives, or your financial situation. We aim to bring you long-term focused analysis driven by fundamental data. Note that our analysis may not factor in the latest price-sensitive company announcements or qualitative material. Simply Wall St has no position in any stocks mentioned.
对这篇文章有反馈吗?对内容感到担忧? 取得联系 直接和我们联系。 或者,给编辑团队 (at) simplywallst.com 发送电子邮件。
Simply Wall St 的这篇文章本质上是一般性的。 我们仅使用不偏不倚的方法根据历史数据和分析师预测提供评论,我们的文章并非旨在提供财务建议。 它不构成买入或卖出任何股票的建议,也没有考虑您的目标或财务状况。我们的目标是为您提供由基本面数据驱动的长期重点分析。请注意,我们的分析可能未将最新的价格敏感型公司公告或定性材料考虑在内。简而言之,华尔街对上述任何股票都没有头寸。
译文内容由第三方软件翻译。