
Carlisle Companies Incorporated (NYSE:CSL) Shares Could Be 29% Below Their Intrinsic Value Estimate
Carlisle Companies Incorporated (NYSE:CSL) Shares Could Be 29% Below Their Intrinsic Value Estimate
How far off is Carlisle Companies Incorporated (NYSE:CSL) from its intrinsic value? Using the most recent financial data, we'll take a look at whether the stock is fairly priced by projecting its future cash flows and then discounting them to today's value. Our analysis will employ the Discounted Cash Flow (DCF) model. Models like these may appear beyond the comprehension of a lay person, but they're fairly easy to follow.
卡莱尔公司(纽约证券交易所代码:CSL)距离其内在价值还有多远?使用最新的财务数据,我们将通过预测未来的现金流,然后将其贴现到今天的价值,来看看股票的定价是否公平。我们的分析将采用贴现现金流(DCF)模型。像这样的模型可能看起来超出了外行的理解,但它们很容易被效仿。
We generally believe that a company's value is the present value of all of the cash it will generate in the future. However, a DCF is just one valuation metric among many, and it is not without flaws. If you want to learn more about discounted cash flow, the rationale behind this calculation can be read in detail in the Simply Wall St analysis model.
我们通常认为,一家公司的价值是它未来将产生的所有现金的现值。然而,贴现现金流只是众多估值指标中的一个,它也并非没有缺陷。如果你想了解更多关于贴现现金流的信息,可以在Simply Wall St.分析模型中详细阅读这种计算背后的原理。
See our latest analysis for Carlisle Companies
查看我们对卡莱尔公司的最新分析
Step By Step Through The Calculation
一步一步地计算
We use what is known as a 2-stage model, which simply means we have two different periods of growth rates for the company's cash flows. Generally the first stage is higher growth, and the second stage is a lower growth phase. To begin with, we have to get estimates of the next ten years of cash flows. Where possible we use analyst estimates, but when these aren't available we extrapolate the previous free cash flow (FCF) from the last estimate or reported value. We assume companies with shrinking free cash flow will slow their rate of shrinkage, and that companies with growing free cash flow will see their growth rate slow, over this period. We do this to reflect that growth tends to slow more in the early years than it does in later years.
我们使用所谓的两阶段模型,也就是说,公司的现金流有两个不同的增长率。一般来说,第一阶段是较高增长阶段,第二阶段是较低增长阶段。首先,我们必须对未来十年的现金流进行估计。在可能的情况下,我们使用分析师的估计,但当这些估计不可用时,我们会根据上次估计或报告的价值推断先前的自由现金流(FCF)。我们假设,自由现金流萎缩的公司将减缓收缩速度,而自由现金流增长的公司在这段时间内的增长速度将放缓。我们这样做是为了反映出,增长在最初几年往往比后来几年放缓得更多。
A DCF is all about the idea that a dollar in the future is less valuable than a dollar today, so we need to discount the sum of these future cash flows to arrive at a present value estimate:
贴现现金流就是这样一种想法,即未来一美元的价值低于现在的一美元,因此我们需要对这些未来现金流的总和进行贴现,以得出现值估计:
10-year free cash flow (FCF) estimate
10年自由现金流(FCF)估计
| 2023 | 2024 | 2025 | 2026 | 2027 | 2028 | 2029 | 2030 | 2031 | 2032 | |
| Levered FCF ($, Millions) | US$1.02b | US$1.04b | US$1.24b | US$1.33b | US$1.41b | US$1.47b | US$1.53b | US$1.58b | US$1.63b | US$1.67b |
| Growth Rate Estimate Source | Analyst x5 | Analyst x4 | Analyst x1 | Est @ 7.55% | Est @ 5.88% | Est @ 4.71% | Est @ 3.89% | Est @ 3.32% | Est @ 2.92% | Est @ 2.64% |
| Present Value ($, Millions) Discounted @ 9.1% | US$932 | US$876 | US$951 | US$937 | US$910 | US$873 | US$831 | US$787 | US$743 | US$699 |
| 2023 | 2024 | 2025 | 2026 | 2027 | 2028 | 2029 | 2030 | 2031 | 2032 | |
| 杠杆式FCF(百万美元) | 10.2亿美元 | 10.4亿美元 | 12.4亿美元 | 13.3亿美元 | 14.1亿美元 | 14.7亿美元 | 15.3亿美元 | 15.8亿美元 | 16.3亿美元 | 16.7亿美元 |
| 增长率预估来源 | 分析师X5 | 分析师x4 | 分析师x1 | Est@7.55% | Est@5.88% | Est@4.71% | Est@3.89% | Est@3.32% | Est@2.92% | Est@2.64% |
| 现值(美元,百万)贴现@9.1% | 932美元 | 876美元 | 951美元 | 937美元 | 910美元 | 873美元 | 831美元 | 787美元 | 743美元 | 699美元 |
("Est" = FCF growth rate estimated by Simply Wall St)
Present Value of 10-year Cash Flow (PVCF) = US$8.5b
(“EST”=Simply Wall St.预估的FCF成长率)
10年期现金流现值(PVCF)=85亿美元
We now need to calculate the Terminal Value, which accounts for all the future cash flows after this ten year period. For a number of reasons a very conservative growth rate is used that cannot exceed that of a country's GDP growth. In this case we have used the 5-year average of the 10-year government bond yield (2.0%) to estimate future growth. In the same way as with the 10-year 'growth' period, we discount future cash flows to today's value, using a cost of equity of 9.1%.
我们现在需要计算终端价值,它说明了这十年之后的所有未来现金流。出于一些原因,使用了一个非常保守的增长率,不能超过一个国家的国内生产总值增长率。在这种情况下,我们使用了10年期政府债券收益率的5年平均值(2.0%)来估计未来的增长。与10年“增长”期一样,我们使用9.1%的权益成本将未来现金流贴现至当前价值。
Terminal Value (TV)= FCF2032 × (1 + g) ÷ (r – g) = US$1.7b× (1 + 2.0%) ÷ (9.1%– 2.0%) = US$24b
终端值(TV)=FCF2032×(1+g)?(r-g)=17亿美元×(1+2.0%)?(9.1%-2.0%)=240亿美元
Present Value of Terminal Value (PVTV)= TV / (1 + r)10= US$24b÷ ( 1 + 9.1%)10= US$10b
终值现值(PVTV)=TV/(1+r)10=240亿美元?(1+9.1%)10=100亿美元
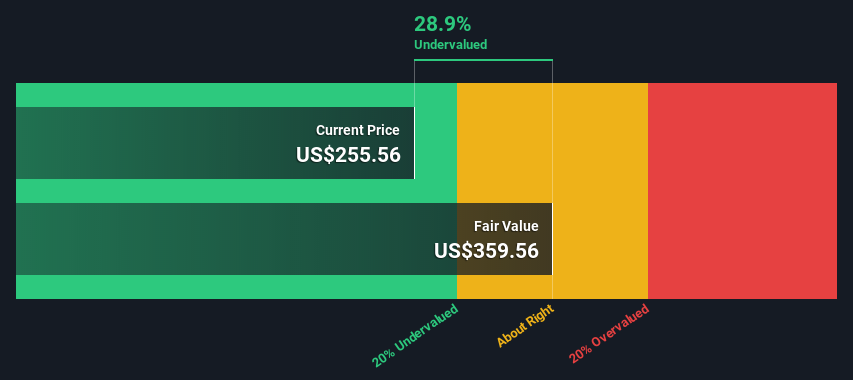
The total value, or equity value, is then the sum of the present value of the future cash flows, which in this case is US$19b. In the final step we divide the equity value by the number of shares outstanding. Relative to the current share price of US$256, the company appears a touch undervalued at a 29% discount to where the stock price trades currently. Remember though, that this is just an approximate valuation, and like any complex formula - garbage in, garbage out.
那么,总价值或股权价值就是未来现金流的现值之和,在这种情况下,现金流是190亿美元。在最后一步,我们用股本价值除以流通股的数量。相对于目前256美元的股价,该公司的估值似乎略有低估,较目前的股价有29%的折让。不过,请记住,这只是一个大致的估值,就像任何复杂的公式一样--垃圾输入,垃圾输出。

Important Assumptions
重要假设
We would point out that the most important inputs to a discounted cash flow are the discount rate and of course the actual cash flows. Part of investing is coming up with your own evaluation of a company's future performance, so try the calculation yourself and check your own assumptions. The DCF also does not consider the possible cyclicality of an industry, or a company's future capital requirements, so it does not give a full picture of a company's potential performance. Given that we are looking at Carlisle Companies as potential shareholders, the cost of equity is used as the discount rate, rather than the cost of capital (or weighted average cost of capital, WACC) which accounts for debt. In this calculation we've used 9.1%, which is based on a levered beta of 1.185. Beta is a measure of a stock's volatility, compared to the market as a whole. We get our beta from the industry average beta of globally comparable companies, with an imposed limit between 0.8 and 2.0, which is a reasonable range for a stable business.
我们要指出,贴现现金流最重要的投入是贴现率,当然还有实际现金流。投资的一部分是你自己对一家公司未来业绩的评估,所以你自己试一试计算,检查你自己的假设。DCF也没有考虑一个行业可能的周期性,也没有考虑一家公司未来的资本要求,因此它没有给出一家公司潜在业绩的全貌。鉴于我们将卡莱尔公司视为潜在股东,股权成本被用作贴现率,而不是占债务的资本成本(或加权平均资本成本,WACC)。在这个计算中,我们使用了9.1%,这是基于杠杆率为1.185的测试版。贝塔系数是衡量一只股票相对于整个市场的波动性的指标。我们的贝塔系数来自全球可比公司的行业平均贝塔系数,强制限制在0.8到2.0之间,这是一个稳定业务的合理范围。
SWOT Analysis for Carlisle Companies
卡莱尔公司的SWOT分析
- Earnings growth over the past year exceeded the industry.
- 过去一年的收益增长超过了行业。
- Debt is well covered by earnings and cashflows.
- 债务由收益和现金流很好地覆盖了。
- Dividends are covered by earnings and cash flows.
- 股息由收益和现金流支付。
- Dividend information for CSL.
- 中超的股息信息。
- Dividend is low compared to the top 25% of dividend payers in the Building market.
- 与建筑市场前25%的股息支付者相比,股息很低。
- Annual earnings are forecast to grow for the next 4 years.
- 预计未来4年的年收入将会增长。
- Good value based on P/E ratio and estimated fair value.
- 基于市盈率和估计公允价值的良好价值。
- Annual earnings are forecast to grow slower than the American market.
- 据预测,该公司的年收入增速将低于美国市场。
- What else are analysts forecasting for CSL?
- 分析师们对中超还有什么预测?
Moving On:
下一步:
Whilst important, the DCF calculation is only one of many factors that you need to assess for a company. It's not possible to obtain a foolproof valuation with a DCF model. Rather it should be seen as a guide to "what assumptions need to be true for this stock to be under/overvalued?" If a company grows at a different rate, or if its cost of equity or risk free rate changes sharply, the output can look very different. Why is the intrinsic value higher than the current share price? For Carlisle Companies, we've put together three further aspects you should further research:
虽然贴现现金流的计算很重要,但它只是一家公司需要评估的众多因素之一。用贴现现金流模型不可能获得万无一失的估值。相反,它应该被视为“什么假设需要成立才能让这只股票被低估或高估”的指南。如果一家公司以不同的速度增长,或者如果其股本成本或无风险利率大幅变化,产出可能看起来非常不同。为什么内在价值高于当前股价?对于卡莱尔公司,我们总结了三个你应该进一步研究的方面:
- Risks: We feel that you should assess the 1 warning sign for Carlisle Companies we've flagged before making an investment in the company.
- Future Earnings: How does CSL's growth rate compare to its peers and the wider market? Dig deeper into the analyst consensus number for the upcoming years by interacting with our free analyst growth expectation chart.
- Other High Quality Alternatives: Do you like a good all-rounder? Explore our interactive list of high quality stocks to get an idea of what else is out there you may be missing!
- 风险:我们认为您应该评估卡莱尔公司的1个警告标志在投资这家公司之前,我们已经做了标记。
- 未来收益:与同行和更广泛的市场相比,CSL的增长速度如何?通过与我们的免费分析师增长预期图表互动,更深入地挖掘分析师对未来几年的共识数字。
- 其他高质量替代产品:你喜欢一个好的全能运动员吗?浏览我们的高质量股票互动列表,了解您可能会错过的其他股票!
PS. The Simply Wall St app conducts a discounted cash flow valuation for every stock on the NYSE every day. If you want to find the calculation for other stocks just search here.
PS.Simply Wall St.应用每天对纽约证交所的每只股票进行现金流贴现估值。如果你想找到其他股票的计算方法,只需搜索此处。
Have feedback on this article? Concerned about the content? Get in touch with us directly. Alternatively, email editorial-team (at) simplywallst.com.
This article by Simply Wall St is general in nature. We provide commentary based on historical data and analyst forecasts only using an unbiased methodology and our articles are not intended to be financial advice. It does not constitute a recommendation to buy or sell any stock, and does not take account of your objectives, or your financial situation. We aim to bring you long-term focused analysis driven by fundamental data. Note that our analysis may not factor in the latest price-sensitive company announcements or qualitative material. Simply Wall St has no position in any stocks mentioned.
对这篇文章有什么反馈吗?担心内容吗? 保持联系直接与我们联系。或者,也可以给编辑组发电子邮件,地址是implywallst.com。
本文由Simply Wall St.撰写,具有概括性。我们仅使用不偏不倚的方法提供基于历史数据和分析师预测的评论,我们的文章并不打算作为财务建议。它不构成买卖任何股票的建议,也没有考虑你的目标或你的财务状况。我们的目标是为您带来由基本面数据驱动的长期重点分析。请注意,我们的分析可能不会将最新的对价格敏感的公司公告或定性材料考虑在内。Simply Wall St.对上述任何一只股票都没有持仓。
译文内容由第三方软件翻译。