
MicroAlgo's (NASDAQ:MLGO) One-year Decline in Earnings Translates Into Losses for Shareholders
MicroAlgo's (NASDAQ:MLGO) One-year Decline in Earnings Translates Into Losses for Shareholders
This month, we saw the MicroAlgo Inc. (NASDAQ:MLGO) up an impressive 132%. But that doesn't change the fact that the returns over the last year have been stomach churning. During that time the share price has plummeted like a stone, down 71%. It's not uncommon to see a bounce after a drop like that. The bigger issue is whether the company can sustain the momentum in the long term.
這個月,我們看到了 微阿爾戈股份有限公司 (納斯達克:MLGO) 上升了令人印象深刻 132%.但是,這並不能改變過去一年的回報一直在胃攪動的事實。在此期間,股價像一塊石頭一樣暴跌,下降了 71%。這樣的下降後看到反彈並不罕見。更大的問題是該公司是否能夠長期維持這一勢頭。
While the last year has been tough for MicroAlgo shareholders, this past week has shown signs of promise. So let's look at the longer term fundamentals and see if they've been the driver of the negative returns.
儘管去年對 MicroAlGo 股東來說是艱難的,但過去一周顯示出了承諾的跡象。因此,讓我們看看長期的基本面,看看它們是否已經成為負回報的驅動力。
See our latest analysis for MicroAlgo
查看我們最新的微 ALGO 分析
While the efficient markets hypothesis continues to be taught by some, it has been proven that markets are over-reactive dynamic systems, and investors are not always rational. One imperfect but simple way to consider how the market perception of a company has shifted is to compare the change in the earnings per share (EPS) with the share price movement.
雖然有些人繼續教授有效的市場假說,但已證明市場是過度反應的動態系統,投資者並不總是理性的。考慮公司市場看法如何轉變的一個不完美但簡單的方法是將每股盈利的變化與股價變動進行比較。
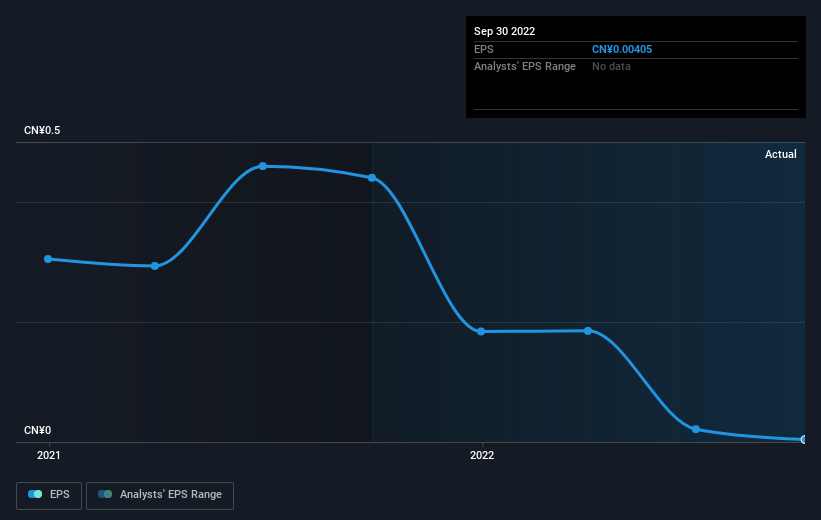
Unhappily, MicroAlgo had to report a 99% decline in EPS over the last year. This fall in the EPS is significantly worse than the 71% the share price fall. So despite the weak per-share profits, some investors are probably relieved the situation wasn't more difficult. With a P/E ratio of 710.63, it's fair to say the market sees an EPS rebound on the cards.
不幸的是,微型 ALGO 不得不報告過去一年每股盈利下降了 99%。每股盈餘今年下跌比股價下跌的 71% 差。因此,儘管每股利潤疲弱,但一些投資者可能會放心,情況並不困難。市盈率為 710.63,可以公平地說市場看到每股盈餘在卡上反彈是可行的。
The graphic below depicts how EPS has changed over time (unveil the exact values by clicking on the image).
下圖說明 EPS 隨時間變化的方式 (按一下影像即可顯示確切值)。
This free interactive report on MicroAlgo's earnings, revenue and cash flow is a great place to start, if you want to investigate the stock further.
這 自由 如果您想進一步調查股票,則關於 MicroalGo 的收益,收入和現金流的交互式報告是一個很好的起點。
A Different Perspective
不同的角度
MicroAlgo shareholders are down 71% for the year, even worse than the market loss of 7.7%. There's no doubt that's a disappointment, but the stock may well have fared better in a stronger market. The share price decline has continued throughout the most recent three months, down 68%, suggesting an absence of enthusiasm from investors. Basically, most investors should be wary of buying into a poor-performing stock, unless the business itself has clearly improved. I find it very interesting to look at share price over the long term as a proxy for business performance. But to truly gain insight, we need to consider other information, too. Like risks, for instance. Every company has them, and we've spotted 4 warning signs for MicroAlgo (of which 2 are a bit concerning!) you should know about.
微 ALGO 股東全年下跌 71%,甚至比市場虧損 7.7% 更糟。毫無疑問,這令人失望,但股票在更強大的市場中表現可能更好。最近三個月,股價下跌一直持續下跌 68%,表明投資者缺乏熱情。基本上,除非業務本身有明顯改善,否則大多數投資者應該警惕購買表現不佳的股票。從長遠來看股價作為業務表現的代理,我覺得非常有趣。但是要真正獲得洞察力,我們也需要考慮其他信息。例如,就像風險一樣。每個公司都有它們,我們已經發現 4 微型 ALGO 的警告標誌 (其中 2 有點令人擔憂!)你應該知道
Of course MicroAlgo may not be the best stock to buy. So you may wish to see this free collection of growth stocks.
當然 微 ALGO 可能不是最好的股票買。所以大家不妨看看這個 自由 集合,... 的, 增長, 股票
Please note, the market returns quoted in this article reflect the market weighted average returns of stocks that currently trade on US exchanges.
請注意,本文中引用的市場回報反映了當前在美國交易所交易的股票的市場加權平均回報。
Have feedback on this article? Concerned about the content? Get in touch with us directly. Alternatively, email editorial-team (at) simplywallst.com.
This article by Simply Wall St is general in nature. We provide commentary based on historical data and analyst forecasts only using an unbiased methodology and our articles are not intended to be financial advice. It does not constitute a recommendation to buy or sell any stock, and does not take account of your objectives, or your financial situation. We aim to bring you long-term focused analysis driven by fundamental data. Note that our analysis may not factor in the latest price-sensitive company announcements or qualitative material. Simply Wall St has no position in any stocks mentioned.
對這篇文章有反饋嗎?關注內容? 取得聯繫 直接與我們聯繫。 或者,通過電子郵件發送電子郵件給編輯團隊。
這篇文章由簡單牆聖是一般性質. 我們僅使用公正的方法,根據歷史數據和分析師預測提供評論,我們的文章並不打算作為財務建議。 它並不構成購買或出售任何股票的建議,也不會考慮您的目標或您的財務狀況。我們的目標是為您帶來由基本數據驅動的長期集中分析。請注意,我們的分析可能不會考慮最新的價格敏感公司公告或定性材料。簡易華街在提及的任何股票中都沒有倉位。
譯文內容由第三人軟體翻譯。