
Investing in Singapore Exchange (SGX:S68) Five Years Ago Would Have Delivered You a 42% Gain
Investing in Singapore Exchange (SGX:S68) Five Years Ago Would Have Delivered You a 42% Gain
Generally speaking the aim of active stock picking is to find companies that provide returns that are superior to the market average. And while active stock picking involves risks (and requires diversification) it can also provide excess returns. For example, long term Singapore Exchange Limited (SGX:S68) shareholders have enjoyed a 18% share price rise over the last half decade, well in excess of the market decline of around 24% (not including dividends).
一般而言,主动选股的目的是寻找回报高于市场平均水平的公司。虽然主动选股涉及风险(需要多元化),但它也可以提供超额回报。例如,长期 新加坡交易所有限公司 (SGX: S68) 股东在过去五年中股价上涨了18%,远远超过了24%左右的市场跌幅(不包括股息)。
So let's assess the underlying fundamentals over the last 5 years and see if they've moved in lock-step with shareholder returns.
因此,让我们评估过去5年的基本面,看看它们是否与股东回报步调一致。
View our latest analysis for Singapore Exchange
查看我们对新加坡交易所的最新分析
In his essay The Superinvestors of Graham-and-Doddsville Warren Buffett described how share prices do not always rationally reflect the value of a business. One flawed but reasonable way to assess how sentiment around a company has changed is to compare the earnings per share (EPS) with the share price.
在他的文章中 格雷厄姆和多兹维尔的超级投资者 沃伦·巴菲特描述了股价如何并不总是合理地反映企业的价值。评估公司情绪变化的一种有缺陷但合理的方法是将每股收益(EPS)与股价进行比较。
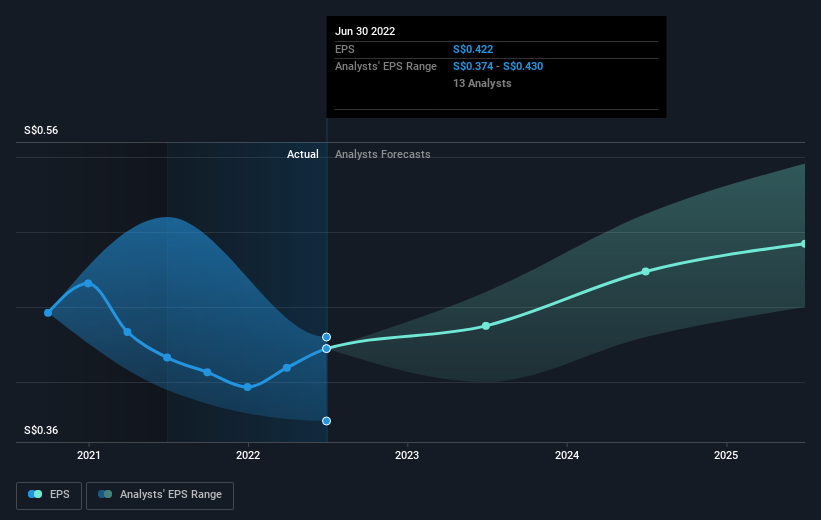
Over half a decade, Singapore Exchange managed to grow its earnings per share at 5.9% a year. The EPS growth is more impressive than the yearly share price gain of 3% over the same period. Therefore, it seems the market has become relatively pessimistic about the company.
在过去的五年中,新加坡交易所设法将其每股收益增长到每年5.9%。每股收益的增长比同期每年3%的股价上涨更为令人印象深刻。因此,市场似乎对该公司变得相对悲观了。
The company's earnings per share (over time) is depicted in the image below (click to see the exact numbers).
该公司的每股收益(随着时间的推移)如下图所示(点击查看确切数字)。
This free interactive report on Singapore Exchange's earnings, revenue and cash flow is a great place to start, if you want to investigate the stock further.
这个 免费的 如果你想进一步调查该股,那么关于新加坡交易所收益、收入和现金流的互动报告是一个不错的起点。
What About Dividends?
那股息呢?
As well as measuring the share price return, investors should also consider the total shareholder return (TSR). The TSR incorporates the value of any spin-offs or discounted capital raisings, along with any dividends, based on the assumption that the dividends are reinvested. It's fair to say that the TSR gives a more complete picture for stocks that pay a dividend. As it happens, Singapore Exchange's TSR for the last 5 years was 42%, which exceeds the share price return mentioned earlier. This is largely a result of its dividend payments!
除了衡量股价回报外,投资者还应考虑股东总回报(TSR)。TSR纳入了任何分拆或折扣资本筹集的价值以及任何股息,前提是股息是再投资的。可以公平地说,TSR更全面地描述了支付股息的股票。碰巧的是,新加坡交易所过去5年的股东总回报率为42%,超过了前面提到的股价回报率。这在很大程度上是其支付股息的结果!
A Different Perspective
不同的视角
Investors in Singapore Exchange had a tough year, with a total loss of 3.3% (including dividends), against a market gain of about 1.9%. However, keep in mind that even the best stocks will sometimes underperform the market over a twelve month period. On the bright side, long term shareholders have made money, with a gain of 7% per year over half a decade. It could be that the recent sell-off is an opportunity, so it may be worth checking the fundamental data for signs of a long term growth trend. Before forming an opinion on Singapore Exchange you might want to consider the cold hard cash it pays as a dividend. This free chart tracks its dividend over time.
新加坡交易所的投资者经历了艰难的一年,总亏损3.3%(包括股息),而市场涨幅约为1.9%。但是,请记住,即使是最好的股票有时也会在十二个月内跑赢市场。好的一面是,长期股东已经赚了钱,在过去的五年中,他们每年增长7%。最近的抛售可能是一个机会,因此可能值得查看基本面数据,寻找长期增长趋势的迹象。在对新加坡交易所发表意见之前,你可能需要考虑将其支付的冷硬现金作为股息。这个 免费的 图表追踪其一段时间内的股息。
If you would prefer to check out another company -- one with potentially superior financials -- then do not miss this free list of companies that have proven they can grow earnings.
如果你想去另一家公司看看 —— 一家财务状况可能优异的公司 —— 那千万不要错过这个 免费的 已证明可以增加收益的公司名单。
Please note, the market returns quoted in this article reflect the market weighted average returns of stocks that currently trade on SG exchanges.
请注意,本文引用的市场回报反映了目前在新加坡交易所交易的股票的市场加权平均回报。
Have feedback on this article? Concerned about the content? Get in touch with us directly. Alternatively, email editorial-team (at) simplywallst.com.
This article by Simply Wall St is general in nature. We provide commentary based on historical data and analyst forecasts only using an unbiased methodology and our articles are not intended to be financial advice. It does not constitute a recommendation to buy or sell any stock, and does not take account of your objectives, or your financial situation. We aim to bring you long-term focused analysis driven by fundamental data. Note that our analysis may not factor in the latest price-sensitive company announcements or qualitative material. Simply Wall St has no position in any stocks mentioned.
对这篇文章有反馈吗?对内容感到担忧? 取得联系 直接和我们联系。 或者,给编辑团队 (at) simplywallst.com 发送电子邮件。
Simply Wall St 的这篇文章本质上是一般性的。 我们仅使用不偏不倚的方法根据历史数据和分析师预测提供评论,我们的文章并非旨在提供财务建议。 它不构成买入或卖出任何股票的建议,也没有考虑您的目标或财务状况。我们的目标是为您提供由基本面数据驱动的长期重点分析。请注意,我们的分析可能未将最新的价格敏感型公司公告或定性材料考虑在内。简而言之,华尔街对上述任何股票都没有头寸。
译文内容由第三方软件翻译。