
Zhejiang Xinan Chemical Industrial GroupLtd's (SHSE:600596) Earnings Growth Rate Lags the 21% CAGR Delivered to Shareholders
Zhejiang Xinan Chemical Industrial GroupLtd's (SHSE:600596) Earnings Growth Rate Lags the 21% CAGR Delivered to Shareholders
When you buy a stock there is always a possibility that it could drop 100%. But on the bright side, if you buy shares in a high quality company at the right price, you can gain well over 100%. For instance, the price of Zhejiang Xinan Chemical Industrial Group Co.,Ltd (SHSE:600596) stock is up an impressive 136% over the last five years. It's down 5.4% in the last seven days.
Although Zhejiang Xinan Chemical Industrial GroupLtd has shed CN¥1.0b from its market cap this week, let's take a look at its longer term fundamental trends and see if they've driven returns.
View our latest analysis for Zhejiang Xinan Chemical Industrial GroupLtd
To paraphrase Benjamin Graham: Over the short term the market is a voting machine, but over the long term it's a weighing machine. By comparing earnings per share (EPS) and share price changes over time, we can get a feel for how investor attitudes to a company have morphed over time.
Over half a decade, Zhejiang Xinan Chemical Industrial GroupLtd managed to grow its earnings per share at 59% a year. The EPS growth is more impressive than the yearly share price gain of 19% over the same period. So one could conclude that the broader market has become more cautious towards the stock. The reasonably low P/E ratio of 4.49 also suggests market apprehension.
You can see below how EPS has changed over time (discover the exact values by clicking on the image).
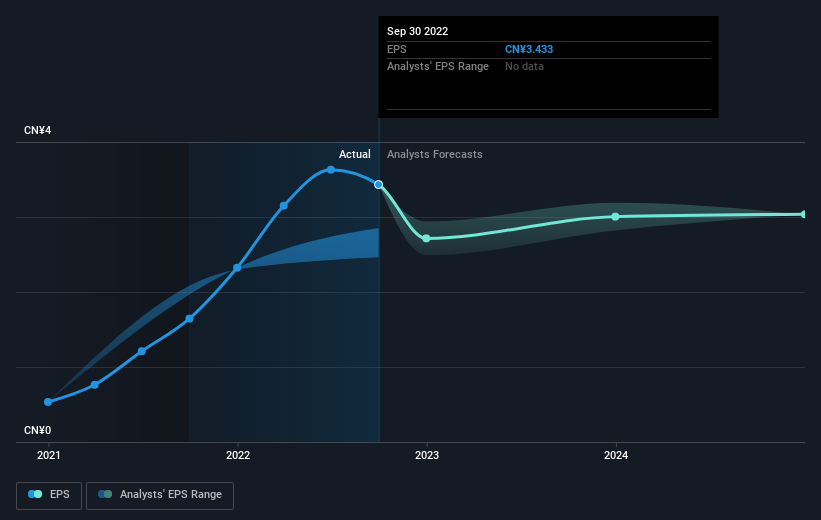 SHSE:600596 Earnings Per Share Growth December 23rd 2022
It is of course excellent to see how Zhejiang Xinan Chemical Industrial GroupLtd has grown profits over the years, but the future is more important for shareholders. If you are thinking of buying or selling Zhejiang Xinan Chemical Industrial GroupLtd stock, you should check out this FREE detailed report on its balance sheet.
What About Dividends?
When looking at investment returns, it is important to consider the difference between total shareholder return (TSR) and share price return. Whereas the share price return only reflects the change in the share price, the TSR includes the value of dividends (assuming they were reinvested) and the benefit of any discounted capital raising or spin-off. So for companies that pay a generous dividend, the TSR is often a lot higher than the share price return. As it happens, Zhejiang Xinan Chemical Industrial GroupLtd's TSR for the last 5 years was 157%, which exceeds the share price return mentioned earlier. This is largely a result of its dividend payments!
A Different Perspective
While it's certainly disappointing to see that Zhejiang Xinan Chemical Industrial GroupLtd shares lost 14% throughout the year, that wasn't as bad as the market loss of 19%. Of course, the long term returns are far more important and the good news is that over five years, the stock has returned 21% for each year. It could be that the business is just facing some short term problems, but shareholders should keep a close eye on the fundamentals. I find it very interesting to look at share price over the long term as a proxy for business performance. But to truly gain insight, we need to consider other information, too. Case in point: We've spotted 1 warning sign for Zhejiang Xinan Chemical Industrial GroupLtd you should be aware of.
If you like to buy stocks alongside management, then you might just love this free list of companies. (Hint: insiders have been buying them).
Please note, the market returns quoted in this article reflect the market weighted average returns of stocks that currently trade on CN exchanges.
Have feedback on this article? Concerned about the content? Get in touch with us directly. Alternatively, email editorial-team (at) simplywallst.com.
This article by Simply Wall St is general in nature. We provide commentary based on historical data and analyst forecasts only using an unbiased methodology and our articles are not intended to be financial advice. It does not constitute a recommendation to buy or sell any stock, and does not take account of your objectives, or your financial situation. We aim to bring you long-term focused analysis driven by fundamental data. Note that our analysis may not factor in the latest price-sensitive company announcements or qualitative material. Simply Wall St has no position in any stocks mentioned.
當您購買股票時,總有可能下降 100%。但是從好的一面來看,如果您以合適的價格購買高質量公司的股票,則可以獲得 100% 以上的收益。例如,價格 浙江新安化工集團有限公司, 有限公司 股票代號:600596)在過去五年中,股票上漲了令人印象深刻的 136%。在過去的七天裡下降了 5.4%。
雖然浙江新安化工集團本周已經從市值上下降了 1.0 億元人民幣,但讓我們來看看它的長期基本趨勢,看看它們是否帶動了回報。
查看我們對浙江新安化工產業有限公司的最新分析
釋義本傑明·格雷厄姆:在短期內,市場是一台投票機,但從長遠來看,這是一個稱重機。通過比較每股收益(EPS)和股價隨著時間的變化,我們可以了解投資者對公司的態度如何隨著時間的推移而變化。
超過半年的時間,浙江新安化工集團成功地將每股盈利每年增長 59%。每股盈餘的增長比同期的年度股價上漲 19% 更令人印象深刻。因此,人們可以得出結論,更廣泛的市場對股票變得更加謹慎。4.49 的市盈率相當低,也表明市場擔憂。
您可以在下面看到 EPS 隨時間變化的情況(通過單擊圖像以查找確切值)。
股東指數:每股盈利增長 600596 二二二年十二月二十三日看到浙江新安化工 GroUPLATD 多年來如何增長利潤當然是非常好的,但對股東來說,未來更為重要。如果您正在考慮買賣浙江新安化工集團股份有限公司股票,您應該看看這個 免費 其資產負債表的詳細報告。
股息呢?
在查看投資回報時,重要的是要考慮兩者之間的差異 股東總回報 (TSR) 及 股價回報。股價回報僅反映了股價的變化,但 TSR 包括股息的價值(假設股息已經再投資)以及任何折扣資本集資或分拆的利益。因此,對於支付豐厚股息的公司來說,TSR 通常比股價回報高得多。事實上,浙江新安化工集團過去 5 年的 TSR 為 157%,超過前面提到的股價回報。這在很大程度上是其股息支付的結果!
不同的角度
雖然看到浙江新安化工 GroUPLTD 股份在全年下跌 14% 的情況下肯定令人失望,但這並不如市場虧損 19% 那麼糟糕。當然,長期回報是更為重要的,好消息是,五年來,股票每年回報 21%。這可能是業務只是面臨一些短期問題,但股東應密切關注基本面。從長遠來看股價作為業務表現的代理,我覺得非常有趣。但是要真正獲得洞察力,我們也需要考慮其他信息。例子點:我們已經發現 1 號浙江新安化工集團有限公司的警告標誌 你應該知道的。
如果您想與管理層一起購買股票,那麼您可能會喜歡這個 自由 公司名單。(提示:內部人士一直在購買它們)。
請注意,本文中引用的市場回報反映了當前在 CN 交易所交易的股票的市場加權平均回報率。
對這篇文章有反饋嗎?關注內容? 取得聯繫 直接與我們聯繫。 或者,通過電子郵件發送電子郵件給編輯團隊。
這篇文章由簡單牆聖是一般性質. 我們僅使用公正的方法,根據歷史數據和分析師預測提供評論,我們的文章並不打算作為財務建議。 它並不構成購買或出售任何股票的建議,也不會考慮您的目標或您的財務狀況。我們的目標是為您帶來由基本數據驅動的長期集中分析。請注意,我們的分析可能不會考慮最新的價格敏感公司公告或定性材料。簡易華街在提及的任何股票中都沒有倉位。
譯文內容由第三人軟體翻譯。
風險及免責聲明
- 分享到weixin
- 分享到qq
- 分享到facebook
- 分享到twitter
- 分享到微博
- 粘贴板
使用瀏覽器的分享功能,分享給你的好友吧