
Prenetics Global Limited (NASDAQ:PRE) Shares Could Be 24% Above Their Intrinsic Value Estimate
Prenetics Global Limited (NASDAQ:PRE) Shares Could Be 24% Above Their Intrinsic Value Estimate
Today we will run through one way of estimating the intrinsic value of Prenetics Global Limited (NASDAQ:PRE) by taking the expected future cash flows and discounting them to today's value. We will take advantage of the Discounted Cash Flow (DCF) model for this purpose. Before you think you won't be able to understand it, just read on! It's actually much less complex than you'd imagine.
We generally believe that a company's value is the present value of all of the cash it will generate in the future. However, a DCF is just one valuation metric among many, and it is not without flaws. If you want to learn more about discounted cash flow, the rationale behind this calculation can be read in detail in the Simply Wall St analysis model.
View our latest analysis for Prenetics Global
Step By Step Through The Calculation
We are going to use a two-stage DCF model, which, as the name states, takes into account two stages of growth. The first stage is generally a higher growth period which levels off heading towards the terminal value, captured in the second 'steady growth' period. In the first stage we need to estimate the cash flows to the business over the next ten years. Seeing as no analyst estimates of free cash flow are available to us, we have extrapolate the previous free cash flow (FCF) from the company's last reported value. We assume companies with shrinking free cash flow will slow their rate of shrinkage, and that companies with growing free cash flow will see their growth rate slow, over this period. We do this to reflect that growth tends to slow more in the early years than it does in later years.
A DCF is all about the idea that a dollar in the future is less valuable than a dollar today, and so the sum of these future cash flows is then discounted to today's value:
10-year free cash flow (FCF) estimate
| 2023 | 2024 | 2025 | 2026 | 2027 | 2028 | 2029 | 2030 | 2031 | 2032 | |
| Levered FCF ($, Millions) | US$6.97m | US$7.51m | US$7.96m | US$8.34m | US$8.67m | US$8.97m | US$9.23m | US$9.48m | US$9.71m | US$9.93m |
| Growth Rate Estimate Source | Est @ 10.21% | Est @ 7.74% | Est @ 6.01% | Est @ 4.8% | Est @ 3.96% | Est @ 3.36% | Est @ 2.95% | Est @ 2.66% | Est @ 2.45% | Est @ 2.31% |
| Present Value ($, Millions) Discounted @ 7.0% | US$6.5 | US$6.6 | US$6.5 | US$6.4 | US$6.2 | US$6.0 | US$5.7 | US$5.5 | US$5.3 | US$5.0 |
("Est" = FCF growth rate estimated by Simply Wall St)
Present Value of 10-year Cash Flow (PVCF) = US$59m
After calculating the present value of future cash flows in the initial 10-year period, we need to calculate the Terminal Value, which accounts for all future cash flows beyond the first stage. The Gordon Growth formula is used to calculate Terminal Value at a future annual growth rate equal to the 5-year average of the 10-year government bond yield of 2.0%. We discount the terminal cash flows to today's value at a cost of equity of 7.0%.
Terminal Value (TV)= FCF2032 × (1 + g) ÷ (r – g) = US$9.9m× (1 + 2.0%) ÷ (7.0%– 2.0%) = US$200m
Present Value of Terminal Value (PVTV)= TV / (1 + r)10= US$200m÷ ( 1 + 7.0%)10= US$102m
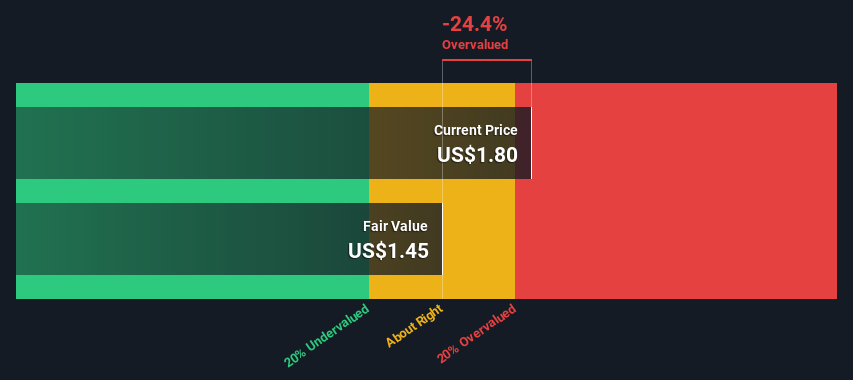
The total value is the sum of cash flows for the next ten years plus the discounted terminal value, which results in the Total Equity Value, which in this case is US$161m. In the final step we divide the equity value by the number of shares outstanding. Relative to the current share price of US$1.8, the company appears slightly overvalued at the time of writing. The assumptions in any calculation have a big impact on the valuation, so it is better to view this as a rough estimate, not precise down to the last cent.
 NasdaqGM:PRE Discounted Cash Flow November 29th 2022
The Assumptions
We would point out that the most important inputs to a discounted cash flow are the discount rate and of course the actual cash flows. You don't have to agree with these inputs, I recommend redoing the calculations yourself and playing with them. The DCF also does not consider the possible cyclicality of an industry, or a company's future capital requirements, so it does not give a full picture of a company's potential performance. Given that we are looking at Prenetics Global as potential shareholders, the cost of equity is used as the discount rate, rather than the cost of capital (or weighted average cost of capital, WACC) which accounts for debt. In this calculation we've used 7.0%, which is based on a levered beta of 0.865. Beta is a measure of a stock's volatility, compared to the market as a whole. We get our beta from the industry average beta of globally comparable companies, with an imposed limit between 0.8 and 2.0, which is a reasonable range for a stable business.
Looking Ahead:
Valuation is only one side of the coin in terms of building your investment thesis, and it shouldn't be the only metric you look at when researching a company. DCF models are not the be-all and end-all of investment valuation. Rather it should be seen as a guide to "what assumptions need to be true for this stock to be under/overvalued?" If a company grows at a different rate, or if its cost of equity or risk free rate changes sharply, the output can look very different. Can we work out why the company is trading at a premium to intrinsic value? For Prenetics Global, we've compiled three important elements you should further research:
- Risks: Case in point, we've spotted 1 warning sign for Prenetics Global you should be aware of.
- Future Earnings: How does PRE's growth rate compare to its peers and the wider market? Dig deeper into the analyst consensus number for the upcoming years by interacting with our free analyst growth expectation chart.
- Other Solid Businesses: Low debt, high returns on equity and good past performance are fundamental to a strong business. Why not explore our interactive list of stocks with solid business fundamentals to see if there are other companies you may not have considered!
PS. The Simply Wall St app conducts a discounted cash flow valuation for every stock on the NASDAQGM every day. If you want to find the calculation for other stocks just search here.
Have feedback on this article? Concerned about the content? Get in touch with us directly. Alternatively, email editorial-team (at) simplywallst.com.
This article by Simply Wall St is general in nature. We provide commentary based on historical data and analyst forecasts only using an unbiased methodology and our articles are not intended to be financial advice. It does not constitute a recommendation to buy or sell any stock, and does not take account of your objectives, or your financial situation. We aim to bring you long-term focused analysis driven by fundamental data. Note that our analysis may not factor in the latest price-sensitive company announcements or qualitative material. Simply Wall St has no position in any stocks mentioned.
今天,我們將通過一種方法來估計納斯達克全球有限公司(Pre)的內在價值,方法是將預期的未來現金流折現為今天的價值。為此,我們將利用貼現現金流(DCF)模型。在你認為你將無法理解它之前,只需繼續閲讀!它實際上比你想象的要簡單得多。
我們通常認為,一家公司的價值是它未來將產生的所有現金的現值。然而,貼現現金流只是眾多估值指標中的一個,它也並非沒有缺陷。如果你想了解更多關於貼現現金流的信息,可以在Simply Wall St.分析模型中詳細閲讀這種計算背後的原理。
查看我們對Prentics Global的最新分析
一步一步地計算
我們將使用兩階段貼現現金流模型,顧名思義,該模型考慮了兩個增長階段。第一階段通常是一個較高的成長期,接近終值,在第二個“穩定增長”階段捕捉到。在第一階段,我們需要估計未來十年為企業帶來的現金流。由於沒有分析師對自由現金流的估計,我們根據公司最近報告的價值推斷出了之前的自由現金流(FCF)。我們假設,自由現金流萎縮的公司將減緩收縮速度,而自由現金流增長的公司在這段時間內的增長速度將放緩。我們這樣做是為了反映出,增長在最初幾年往往比後來幾年放緩得更多。
貼現現金流就是這樣一種想法,即未來的一美元不如現在的一美元有價值,因此這些未來現金流的總和就會貼現到今天的價值:
10年自由現金流(FCF)估計
| 2023 | 2024 | 2025 | 2026 | 2027 | 2028 | 2029 | 2030 | 2031 | 2032 | |
| 槓桿式FCF(百萬美元) | 697萬美元 | 751萬美元 | 796萬美元 | 834萬美元 | 867萬美元 | 897萬美元 | 923萬美元 | 948萬美元 | 971萬美元 | 993萬美元 |
| 增長率預估來源 | Est@10.21% | Est@7.74% | Est@6.01% | EST@4.8% | Est@3.96% | Est@3.36% | Est@2.95% | Est@2.66% | Est@2.45% | Est@2.31% |
| 現值(美元,百萬)貼現@7.0% | 6.5美元 | 6.6美元 | 6.5美元 | 美元6.4美元 | 6.2美元 | 美元:6.0美元 | 美元:5.7美元 | 美元:5.5美元 | 5.3美元 | 美元:5.0美元 |
(“EST”=Simply Wall St.預估的FCF成長率)
10年期現金流現值(PVCF)=5900萬美元
在計算了最初10年內未來現金流的現值後,我們需要計算終止值,它考慮了第一階段之後的所有未來現金流。戈登增長公式用於計算終端價值,其未來年增長率等於10年期政府債券收益率2.0%的5年平均水平。我們以7.0%的權益成本將終端現金流貼現到今天的價值。
終端值(TV)=FCF2032×(1+g)?(r-g)=990萬美元×(1+2.0%)?(7.0%-2.0%)=2億美元
終值現值(PVTV)=TV/(1+r)10=2億美元?(1+7.0%)10=1.02億美元
總價值是未來十年的現金流之和加上貼現的終端價值,這導致總股權價值,在這種情況下是1.61億美元。在最後一步,我們用股本價值除以流通股的數量。相對於目前1.8美元的股價,該公司在撰寫本文時似乎略有高估。任何計算中的假設都會對估值產生很大影響,因此最好將其視為粗略估計,而不是精確到最後一分錢。
NasdaqGM:預貼現現金流2022年11月29日假設
我們要指出,貼現現金流最重要的投入是貼現率,當然還有實際現金流。您不必同意這些輸入,我建議您自己重新計算並使用它們。DCF也沒有考慮一個行業可能的週期性,也沒有考慮一家公司未來的資本要求,因此它沒有給出一家公司潛在業績的全貌。鑑於我們將Prentics Global視為潛在股東,股權成本被用作貼現率,而不是佔債務的資本成本(或加權平均資本成本,WACC)。在這個計算中,我們使用了7.0%,這是基於槓桿率為0.865的測試版。貝塔係數是衡量一隻股票相對於整個市場的波動性的指標。我們的貝塔係數來自全球可比公司的行業平均貝塔係數,強制限制在0.8到2.0之間,這是一個穩定業務的合理範圍。
展望未來:
就構建你的投資論文而言,估值只是硬幣的一面,它不應該是你在研究一家公司時唯一考慮的指標。貼現現金流模型並不是投資估值的全部。相反,它應該被視為“什麼假設需要成立才能讓這隻股票被低估或高估”的指南。如果一家公司以不同的速度增長,或者如果其股本成本或無風險利率大幅變化,產出可能看起來非常不同。我們能弄清楚為什麼該公司的股價高於內在價值嗎?在《全球先知》雜誌上,我們整理了三個你應該進一步研究的重要元素:
- 風險:例如,我們已經發現了全球先驅論的1個警告標誌你應該意識到。
- 未來收益:Pre的增長率與同行和更廣泛的市場相比如何?通過與我們的免費分析師增長預期圖表互動,更深入地挖掘分析師對未來幾年的共識數字。
- 其他穩固的企業:低債務、高股本回報率和良好的過去業績是強勁業務的基礎。為什麼不探索我們具有堅實商業基本面的股票的互動列表,看看是否有其他您可能沒有考慮過的公司!
PS.Simply Wall St.應用每天對納斯達克指數中的每一隻股票進行現金流貼現估值。如果你想找到其他股票的計算方法,只需搜索此處。
對這篇文章有什麼反饋嗎?擔心內容嗎? 保持聯繫直接與我們聯繫。或者,也可以給編輯組發電子郵件,地址是implywallst.com。
本文由Simply Wall St.撰寫,具有概括性。我們僅使用不偏不倚的方法提供基於歷史數據和分析師預測的評論,我們的文章並不打算作為財務建議。它不構成買賣任何股票的建議,也沒有考慮你的目標或你的財務狀況。我們的目標是為您帶來由基本面數據驅動的長期重點分析。請注意,我們的分析可能不會將最新的對價格敏感的公司公告或定性材料考慮在內。Simply Wall St.對上述任何一隻股票都沒有持倉。
譯文內容由第三人軟體翻譯。
風險及免責聲明
- 分享到weixin
- 分享到qq
- 分享到facebook
- 分享到twitter
- 分享到微博
- 粘贴板
使用瀏覽器的分享功能,分享給你的好友吧