
 Yahoo Finance
 NIKE (NYSE:NKE) Is Reinvesting At Lower Rates Of Return
Did you know there are some financial metrics that can provide clues of a potential multi-bagger? One common approach is to try and find a company with returns on capital employed (ROCE) that are increasing, in conjunction with a growing amount of capital employed. This shows us that it's a compounding machine, able to continually reinvest its earnings back into the business and generate higher returns. So when we looked at NIKE (NYSE:NKE), they do have a high ROCE, but we weren't exactly elated from how returns are trending.
Understanding Return On Capital Employed (ROCE)
For those that aren't sure what ROCE is, it measures the amount of pre-tax profits a company can generate from the capital employed in its business. The formula for this calculation on NIKE is:
Return on Capital Employed = Earnings Before Interest and Tax (EBIT) ÷ (Total Assets - Current Liabilities)
0.21 = US$6.2b ÷ (US$41b - US$11b) (Based on the trailing twelve months to August 2022).
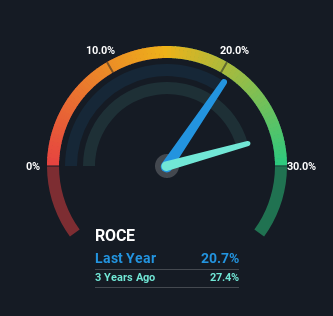
So, NIKE has an ROCE of 21%. That's a fantastic return and not only that, it outpaces the average of 17% earned by companies in a similar industry.
See our latest analysis for NIKE
Above you can see how the current ROCE for NIKE compares to its prior returns on capital, but there's only so much you can tell from the past. If you'd like to see what analysts are forecasting going forward, you should check out our free report for NIKE.
What Can We Tell From NIKE's ROCE Trend?
On the surface, the trend of ROCE at NIKE doesn't inspire confidence. To be more specific, while the ROCE is still high, it's fallen from 26% where it was five years ago. However it looks like NIKE might be reinvesting for long term growth because while capital employed has increased, the company's sales haven't changed much in the last 12 months. It's worth keeping an eye on the company's earnings from here on to see if these investments do end up contributing to the bottom line.
The Key Takeaway
Bringing it all together, while we're somewhat encouraged by NIKE's reinvestment in its own business, we're aware that returns are shrinking. Although the market must be expecting these trends to improve because the stock has gained 85% over the last five years. However, unless these underlying trends turn more positive, we wouldn't get our hopes up too high.
If you're still interested in NIKE it's worth checking out our FREE intrinsic value approximation to see if it's trading at an attractive price in other respects.
If you want to search for more stocks that have been earning high returns, check out this free list of stocks with solid balance sheets that are also earning high returns on equity.
Have feedback on this article? Concerned about the content? Get in touch with us directly. Alternatively, email editorial-team (at) simplywallst.com.
This article by Simply Wall St is general in nature. We provide commentary based on historical data and analyst forecasts only using an unbiased methodology and our articles are not intended to be financial advice. It does not constitute a recommendation to buy or sell any stock, and does not take account of your objectives, or your financial situation. We aim to bring you long-term focused analysis driven by fundamental data. Note that our analysis may not factor in the latest price-sensitive company announcements or qualitative material. Simply Wall St has no position in any stocks mentioned.
Join A Paid User Research Session
You’ll receive a US$30 Amazon Gift card for 1 hour of your time while helping us build better investing tools for the individual investors like yourself. Sign up here
