
 Yahoo Finance
 Grand Banks Yachts (SGX:G50) Is Experiencing Growth In Returns On Capital
What are the early trends we should look for to identify a stock that could multiply in value over the long term? Amongst other things, we'll want to see two things; firstly, a growing return on capital employed (ROCE) and secondly, an expansion in the company's amount of capital employed. Ultimately, this demonstrates that it's a business that is reinvesting profits at increasing rates of return. So on that note, Grand Banks Yachts (SGX:G50) looks quite promising in regards to its trends of return on capital.
Return On Capital Employed (ROCE): What Is It?
If you haven't worked with ROCE before, it measures the 'return' (pre-tax profit) a company generates from capital employed in its business. To calculate this metric for Grand Banks Yachts, this is the formula:
Return on Capital Employed = Earnings Before Interest and Tax (EBIT) ÷ (Total Assets - Current Liabilities)
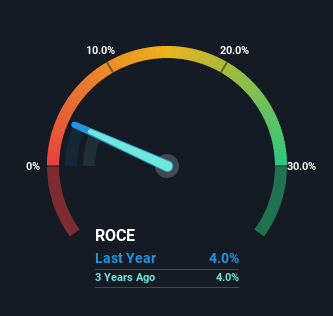
0.04 = S$2.7m ÷ (S$113m - S$46m) (Based on the trailing twelve months to June 2022).
Thus, Grand Banks Yachts has an ROCE of 4.0%. Ultimately, that's a low return and it under-performs the Machinery industry average of 6.5%.
Check out our latest analysis for Grand Banks Yachts
While the past is not representative of the future, it can be helpful to know how a company has performed historically, which is why we have this chart above. If you're interested in investigating Grand Banks Yachts' past further, check out this free graph of past earnings, revenue and cash flow.
What Does the ROCE Trend For Grand Banks Yachts Tell Us?
Even though ROCE is still low in absolute terms, it's good to see it's heading in the right direction. The numbers show that in the last five years, the returns generated on capital employed have grown considerably to 4.0%. The amount of capital employed has increased too, by 38%. So we're very much inspired by what we're seeing at Grand Banks Yachts thanks to its ability to profitably reinvest capital.
On a side note, we noticed that the improvement in ROCE appears to be partly fueled by an increase in current liabilities. Effectively this means that suppliers or short-term creditors are now funding 41% of the business, which is more than it was five years ago. And with current liabilities at those levels, that's pretty high.
The Key Takeaway
To sum it up, Grand Banks Yachts has proven it can reinvest in the business and generate higher returns on that capital employed, which is terrific. Since the total return from the stock has been almost flat over the last five years, there might be an opportunity here if the valuation looks good. So researching this company further and determining whether or not these trends will continue seems justified.
Since virtually every company faces some risks, it's worth knowing what they are, and we've spotted 4 warning signs for Grand Banks Yachts (of which 3 are potentially serious!) that you should know about.
If you want to search for solid companies with great earnings, check out this free list of companies with good balance sheets and impressive returns on equity.
Have feedback on this article? Concerned about the content? Get in touch with us directly. Alternatively, email editorial-team (at) simplywallst.com.
This article by Simply Wall St is general in nature. We provide commentary based on historical data and analyst forecasts only using an unbiased methodology and our articles are not intended to be financial advice. It does not constitute a recommendation to buy or sell any stock, and does not take account of your objectives, or your financial situation. We aim to bring you long-term focused analysis driven by fundamental data. Note that our analysis may not factor in the latest price-sensitive company announcements or qualitative material. Simply Wall St has no position in any stocks mentioned.
Join A Paid User Research Session
You’ll receive a US$30 Amazon Gift card for 1 hour of your time while helping us build better investing tools for the individual investors like yourself. Sign up here
