
Is There An Opportunity With Gogo Inc.'s (NASDAQ:GOGO) 36% Undervaluation?
Is There An Opportunity With Gogo Inc.'s (NASDAQ:GOGO) 36% Undervaluation?
Does the November share price for Gogo Inc. (NASDAQ:GOGO) reflect what it's really worth? Today, we will estimate the stock's intrinsic value by projecting its future cash flows and then discounting them to today's value. We will use the Discounted Cash Flow (DCF) model on this occasion. Don't get put off by the jargon, the math behind it is actually quite straightforward.
We generally believe that a company's value is the present value of all of the cash it will generate in the future. However, a DCF is just one valuation metric among many, and it is not without flaws. If you want to learn more about discounted cash flow, the rationale behind this calculation can be read in detail in the Simply Wall St analysis model.
Check out our latest analysis for Gogo
Is Gogo Fairly Valued?
We are going to use a two-stage DCF model, which, as the name states, takes into account two stages of growth. The first stage is generally a higher growth period which levels off heading towards the terminal value, captured in the second 'steady growth' period. To begin with, we have to get estimates of the next ten years of cash flows. Where possible we use analyst estimates, but when these aren't available we extrapolate the previous free cash flow (FCF) from the last estimate or reported value. We assume companies with shrinking free cash flow will slow their rate of shrinkage, and that companies with growing free cash flow will see their growth rate slow, over this period. We do this to reflect that growth tends to slow more in the early years than it does in later years.
Generally we assume that a dollar today is more valuable than a dollar in the future, so we discount the value of these future cash flows to their estimated value in today's dollars:
10-year free cash flow (FCF) estimate
| 2023 | 2024 | 2025 | 2026 | 2027 | 2028 | 2029 | 2030 | 2031 | 2032 | |
| Levered FCF ($, Millions) | US$105.1m | US$200.9m | US$171.1m | US$154.4m | US$144.7m | US$139.3m | US$136.4m | US$135.3m | US$135.3m | US$136.1m |
| Growth Rate Estimate Source | Analyst x5 | Analyst x3 | Analyst x2 | Est @ -9.76% | Est @ -6.24% | Est @ -3.77% | Est @ -2.05% | Est @ -0.84% | Est @ 0.01% | Est @ 0.6% |
| Present Value ($, Millions) Discounted @ 6.1% | US$99.1 | US$179 | US$143 | US$122 | US$108 | US$97.7 | US$90.2 | US$84.3 | US$79.5 | US$75.4 |
("Est" = FCF growth rate estimated by Simply Wall St)
Present Value of 10-year Cash Flow (PVCF) = US$1.1b
The second stage is also known as Terminal Value, this is the business's cash flow after the first stage. For a number of reasons a very conservative growth rate is used that cannot exceed that of a country's GDP growth. In this case we have used the 5-year average of the 10-year government bond yield (2.0%) to estimate future growth. In the same way as with the 10-year 'growth' period, we discount future cash flows to today's value, using a cost of equity of 6.1%.
Terminal Value (TV)= FCF2032 × (1 + g) ÷ (r – g) = US$136m× (1 + 2.0%) ÷ (6.1%– 2.0%) = US$3.4b
Present Value of Terminal Value (PVTV)= TV / (1 + r)10= US$3.4b÷ ( 1 + 6.1%)10= US$1.9b
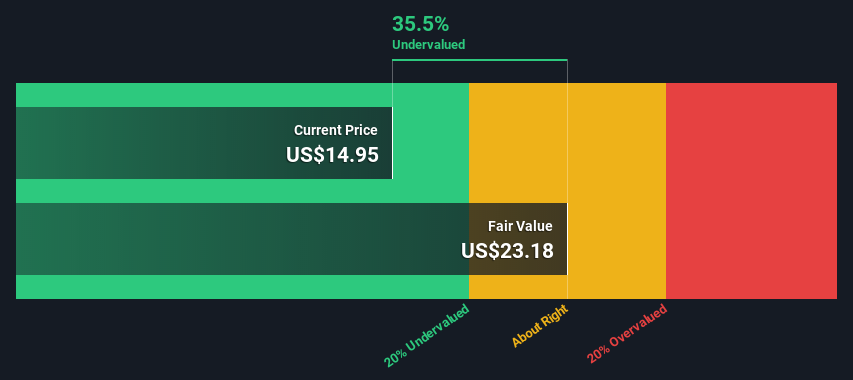
The total value, or equity value, is then the sum of the present value of the future cash flows, which in this case is US$3.0b. To get the intrinsic value per share, we divide this by the total number of shares outstanding. Compared to the current share price of US$15.0, the company appears quite good value at a 36% discount to where the stock price trades currently. Remember though, that this is just an approximate valuation, and like any complex formula - garbage in, garbage out.
 NasdaqGS:GOGO Discounted Cash Flow November 8th 2022
Important Assumptions
We would point out that the most important inputs to a discounted cash flow are the discount rate and of course the actual cash flows. Part of investing is coming up with your own evaluation of a company's future performance, so try the calculation yourself and check your own assumptions. The DCF also does not consider the possible cyclicality of an industry, or a company's future capital requirements, so it does not give a full picture of a company's potential performance. Given that we are looking at Gogo as potential shareholders, the cost of equity is used as the discount rate, rather than the cost of capital (or weighted average cost of capital, WACC) which accounts for debt. In this calculation we've used 6.1%, which is based on a levered beta of 0.800. Beta is a measure of a stock's volatility, compared to the market as a whole. We get our beta from the industry average beta of globally comparable companies, with an imposed limit between 0.8 and 2.0, which is a reasonable range for a stable business.
Looking Ahead:
Valuation is only one side of the coin in terms of building your investment thesis, and it ideally won't be the sole piece of analysis you scrutinize for a company. The DCF model is not a perfect stock valuation tool. Instead the best use for a DCF model is to test certain assumptions and theories to see if they would lead to the company being undervalued or overvalued. For instance, if the terminal value growth rate is adjusted slightly, it can dramatically alter the overall result. What is the reason for the share price sitting below the intrinsic value? For Gogo, there are three additional elements you should further research:
- Risks: Consider for instance, the ever-present spectre of investment risk. We've identified 5 warning signs with Gogo (at least 3 which are concerning) , and understanding them should be part of your investment process.
- Future Earnings: How does GOGO's growth rate compare to its peers and the wider market? Dig deeper into the analyst consensus number for the upcoming years by interacting with our free analyst growth expectation chart.
- Other High Quality Alternatives: Do you like a good all-rounder? Explore our interactive list of high quality stocks to get an idea of what else is out there you may be missing!
PS. The Simply Wall St app conducts a discounted cash flow valuation for every stock on the NASDAQGS every day. If you want to find the calculation for other stocks just search here.
Have feedback on this article? Concerned about the content? Get in touch with us directly. Alternatively, email editorial-team (at) simplywallst.com.
This article by Simply Wall St is general in nature. We provide commentary based on historical data and analyst forecasts only using an unbiased methodology and our articles are not intended to be financial advice. It does not constitute a recommendation to buy or sell any stock, and does not take account of your objectives, or your financial situation. We aim to bring you long-term focused analysis driven by fundamental data. Note that our analysis may not factor in the latest price-sensitive company announcements or qualitative material. Simply Wall St has no position in any stocks mentioned.
谷歌公司(纳斯达克代码:GOGO)11月份的股价反映了它的真实价值吗?今天,我们将通过预测股票未来的现金流,然后将其贴现到今天的价值来估计股票的内在价值。在这种情况下,我们将使用贴现现金流(DCF)模型。不要被行话吓跑了,它背后的数学实际上是相当简单的。
我们通常认为,一家公司的价值是它未来将产生的所有现金的现值。然而,贴现现金流只是众多估值指标中的一个,它也并非没有缺陷。如果你想了解更多关于贴现现金流的信息,可以在Simply Wall St.分析模型中详细阅读这种计算背后的原理。
查看我们对Gogo的最新分析
Gogo的估值公平吗?
我们将使用两阶段贴现现金流模型,顾名思义,该模型考虑了两个增长阶段。第一阶段通常是一个较高的成长期,接近终值,在第二个“稳定增长”阶段捕捉到。首先,我们必须对未来十年的现金流进行估计。在可能的情况下,我们使用分析师的估计,但当这些估计不可用时,我们会根据上次估计或报告的价值推断先前的自由现金流(FCF)。我们假设,自由现金流萎缩的公司将减缓收缩速度,而自由现金流增长的公司在这段时间内的增长速度将放缓。我们这样做是为了反映出,增长在最初几年往往比后来几年放缓得更多。
一般来说,我们假设今天的一美元比未来的一美元更有价值,所以我们将这些未来现金流的价值贴现到以今天美元计算的估计价值:
10年自由现金流(FCF)估计
| 2023 | 2024 | 2025 | 2026 | 2027 | 2028 | 2029 | 2030 | 2031 | 2032 | |
| 杠杆式FCF(百万美元) | 1.051亿美元 | 2.09亿美元 | 1.711亿美元 | 1.544亿美元 | 1.447亿美元 | 1.393亿美元 | 1.364亿美元 | 1.353亿美元 | 1.353亿美元 | 1.361亿美元 |
| 增长率预估来源 | 分析师X5 | 分析师x3 | 分析师x2 | Est@-9.76% | Est@-6.24% | Est@-3.77% | Est@-2.05% | Est@-0.84% | Est@0.01% | Est@0.6% |
| 现值(美元,百万)贴现@6.1% | 99.1美元 | 179美元 | 143美元 | 122美元 | 108美元 | 97.7美元 | 90.2美元 | 84.3美元 | 79.5美元 | 75.4美元 |
(“EST”=Simply Wall St.预估的FCF成长率)
10年期现金流现值(PVCF)=11亿美元
第二阶段也被称为终端价值,这是企业在第一阶段之后的现金流。出于一些原因,使用了一个非常保守的增长率,不能超过一个国家的国内生产总值增长率。在这种情况下,我们使用了10年期政府债券收益率的5年平均值(2.0%)来估计未来的增长。与10年“增长”期一样,我们使用6.1%的权益成本将未来现金流贴现至当前价值。
终端值(TV)=FCF2032×(1+g)?(r-g)=1.36亿美元×(1+2.0%)?(6.1%-2.0%)=34亿美元
终值现值(PVTV)=TV/(1+r)10=34亿美元?(1+6.1%)10=19亿美元
那么,总价值或权益价值就是未来现金流的现值之和,在这种情况下,现金流的现值为30亿美元。为了得到每股内在价值,我们将其除以总流通股数量。与目前15.0美元的股价相比,该公司的价值似乎相当不错,较目前的股价有36%的折让。不过,请记住,这只是一个大致的估值,就像任何复杂的公式一样--垃圾输入,垃圾输出。
NasdaqGS:Gogo贴现现金流2022年11月8日重要假设
我们要指出,贴现现金流最重要的投入是贴现率,当然还有实际现金流。投资的一部分是你自己对一家公司未来业绩的评估,所以你自己试一试计算,检查你自己的假设。DCF也没有考虑一个行业可能的周期性,也没有考虑一家公司未来的资本要求,因此它没有给出一家公司潜在业绩的全貌。鉴于我们将Gogo视为潜在股东,股权成本被用作贴现率,而不是占债务的资本成本(或加权平均资本成本,WACC)。在这个计算中,我们使用了6.1%,这是基于杠杆率为0.800的测试值。贝塔系数是衡量一只股票相对于整个市场的波动性的指标。我们的贝塔系数来自全球可比公司的行业平均贝塔系数,强制限制在0.8到2.0之间,这是一个稳定业务的合理范围。
展望未来:
就构建你的投资论点而言,估值只是硬币的一面,理想情况下,它不会是你为一家公司仔细审查的唯一分析。贴现现金流模型并不是一个完美的股票估值工具。相反,贴现现金流模型的最佳用途是测试某些假设和理论,看看它们是否会导致公司被低估或高估。例如,如果终端价值增长率稍有调整,可能会极大地改变整体结果。股价低于内在价值的原因是什么?对于Gogo,还有三个额外的元素需要进一步研究:
- 风险例如,考虑一下一直存在的投资风险幽灵。我们已经确定了5个警告信号与Gogo合作(至少涉及3个),了解它们应该是你投资过程的一部分。
- 未来收益:与同行和更广泛的市场相比,Gogo的增长率如何?通过与我们的免费分析师增长预期图表互动,更深入地挖掘分析师对未来几年的共识数字。
- 其他高质量替代产品:你喜欢一个好的全能运动员吗?浏览我们的高质量股票互动列表,了解您可能会错过的其他股票!
PS.Simply Wall St.应用程序每天对纳斯达克指数的每一只股票进行现金流贴现估值。如果你想找到其他股票的计算方法,只需搜索此处。
对这篇文章有什么反馈吗?担心内容吗? 保持联系直接与我们联系。或者,也可以给编辑组发电子邮件,地址是implywallst.com。
本文由Simply Wall St.撰写,具有概括性。我们仅使用不偏不倚的方法提供基于历史数据和分析师预测的评论,我们的文章并不打算作为财务建议。它不构成买卖任何股票的建议,也没有考虑你的目标或你的财务状况。我们的目标是为您带来由基本面数据驱动的长期重点分析。请注意,我们的分析可能不会将最新的对价格敏感的公司公告或定性材料考虑在内。Simply Wall St.对上述任何一只股票都没有持仓。
译文内容由第三方软件翻译。
风险及免责提示
- 分享到weixin
- 分享到qq
- 分享到facebook
- 分享到twitter
- 分享到微博
- 粘贴板
使用浏览器的分享功能,分享给你的好友吧