


Digi International (NASDAQ:DGII) Has A Pretty Healthy Balance Sheet
Digi International (NASDAQ:DGII) Has A Pretty Healthy Balance Sheet

 According to the last reported balance sheet, Digi International had liabilities of US$90.3m due within 12 months, and liabilities of US$115.1m due beyond 12 months. Offsetting this, it had US$25.9m in cash and US$64.9m in receivables that were due within 12 months. So its liabilities total US$114.6m more than the combination of its cash and short-term receivables.
 David Iben put it well when he said, 'Volatility is not a risk we care about. What we care about is avoiding the permanent loss of capital.' So it might be obvious that you need to consider debt, when you think about how risky any given stock is, because too much debt can sink a company. We can see that Digi International Inc. (NASDAQ:DGII) does use debt in its business. But is this debt a concern to shareholders?
大衛·伊本很好地說過,『波動性不是我們關心的風險。我們關心的是避免資本的永久損失。』所以,當你考慮任何給定股票的風險時,你需要考慮債務,因爲過多的債務可能會使公司陷入困境。我們可以看到,美國迪進國際(納斯達克:DGII)確實在其業務中使用了債務。但這些債務對股東來說是否構成了擔憂?
When Is Debt A Problem?
何時債務成爲問題?
Debt is a tool to help businesses grow, but if a business is incapable of paying off its lenders, then it exists at their mercy. Ultimately, if the company can't fulfill its legal obligations to repay debt, shareholders could walk away with nothing. While that is not too common, we often do see indebted companies permanently diluting shareholders because lenders force them to raise capital at a distressed price. Of course, plenty of companies use debt to fund growth, without any negative consequences. The first thing to do when considering how much debt a business uses is to look at its cash and debt together.
債務是幫助企業成長的工具,但如果企業無法償還其貸款人,那麼它就在貸款人的掌控之中。最終,如果公司無法履行其法律義務來償還債務,股東可能會一無所獲。雖然這並不常見,但我們經常會看到負債公司永久性稀釋股東,因爲貸款人迫使他們以低價融資。 當然,許多公司利用債務來資助增長,且沒有負面後果。在考慮企業使用多少債務時,首先要查看其現金和債務的總和。
How Much Debt Does Digi International Carry?
美國迪進國際承擔了多少債務?
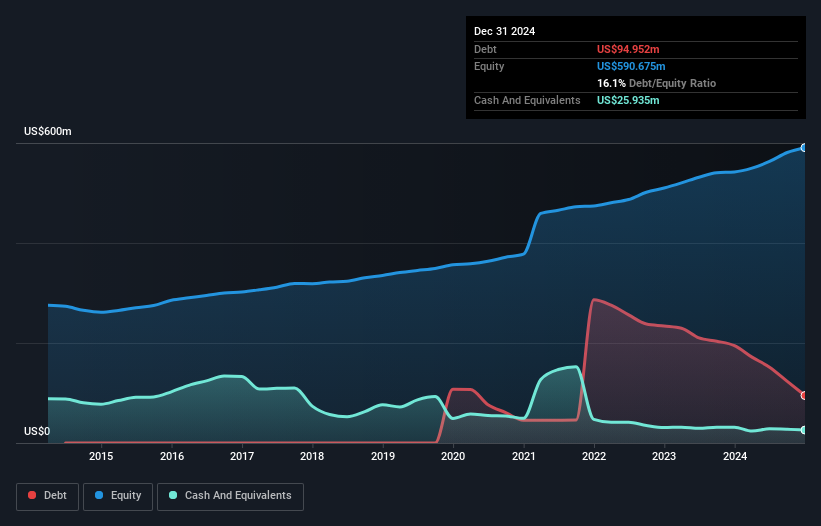
The image below, which you can click on for greater detail, shows that Digi International had debt of US$95.0m at the end of December 2024, a reduction from US$194.7m over a year. However, it also had US$25.9m in cash, and so its net debt is US$69.0m.
下面的圖像,您可以點擊以查看更詳細的信息,顯示截至2024年12月底,美國迪進國際的債務爲9500萬美元,比一年前的19470萬美元有所減少。然而,它還擁有2590萬美元的現金,因此其淨債務爲6900萬美元。
A Look At Digi International's Liabilities
審視美國迪進國際的負債情況
According to the last reported balance sheet, Digi International had liabilities of US$90.3m due within 12 months, and liabilities of US$115.1m due beyond 12 months. Offsetting this, it had US$25.9m in cash and US$64.9m in receivables that were due within 12 months. So its liabilities total US$114.6m more than the combination of its cash and short-term receivables.
根據最後報告的資產負債表,美國迪進國際的負債爲9030萬美元,需在12個月內償還,超過12個月的負債爲11510萬美元。對此,它擁有2590萬美元的現金和6490萬美元的應收款,需在12個月內償還。因此,它的負債總額比其現金和短期應收款的總和多出11460萬美元。
Since publicly traded Digi International shares are worth a total of US$1.07b, it seems unlikely that this level of liabilities would be a major threat. But there are sufficient liabilities that we would certainly recommend shareholders continue to monitor the balance sheet, going forward.
由於公開交易的美國迪進國際股票總值爲10.7億美金,這種負債水平似乎不會構成重大威脅。但負債確實足以讓我們建議股東繼續關注未來的資產負債表。
We use two main ratios to inform us about debt levels relative to earnings. The first is net debt divided by earnings before interest, tax, depreciation, and amortization (EBITDA), while the second is how many times its earnings before interest and tax (EBIT) covers its interest expense (or its interest cover, for short). This way, we consider both the absolute quantum of the debt, as well as the interest rates paid on it.
我們使用兩個主要比率來告知我們關於相對於收益的債務水平。第一個是淨債務除以息稅折舊及攤銷前利潤(EBITDA),而第二個是其息稅前利潤(EBIT)覆蓋利息支出的倍數(簡稱利息覆蓋)。通過這種方式,我們考慮了債務的絕對數量以及爲其支付的利率。
Looking at its net debt to EBITDA of 0.83 and interest cover of 4.1 times, it seems to us that Digi International is probably using debt in a pretty reasonable way. But the interest payments are certainly sufficient to have us thinking about how affordable its debt is. Notably Digi International's EBIT was pretty flat over the last year. Ideally it can diminish its debt load by kick-starting earnings growth. When analysing debt levels, the balance sheet is the obvious place to start. But ultimately the future profitability of the business will decide if Digi International can strengthen its balance sheet over time. So if you're focused on the future you can check out this free report showing analyst profit forecasts.
觀察其淨債務與EBITDA的比率爲0.83,利息覆蓋率爲4.1倍,看來美國迪進國際可能以相當合理的方式使用債務。但利息支付足以讓我們思考其債務的可承受性。值得注意的是,美國迪進國際去年的EBIT相對持平。理想情況下,它可以通過推動收益增長來減少債務負擔。在分析債務水平時,資產負債表是顯而易見的起點。但最終,業務的未來盈利能力將決定美國迪進國際是否能夠隨着時間的推移加強其資產負債表。因此,如果你關注未來,可以查看這份免費的報告,顯示分析師的利潤預測。
Finally, a business needs free cash flow to pay off debt; accounting profits just don't cut it. So we clearly need to look at whether that EBIT is leading to corresponding free cash flow. Happily for any shareholders, Digi International actually produced more free cash flow than EBIT over the last three years. That sort of strong cash generation warms our hearts like a puppy in a bumblebee suit.
最後,企業需要自由現金流來償還債務;會計利潤是不夠的。因此,我們顯然需要看看EBIT是否相應地帶來了自由現金流。值得慶幸的是,對於任何股東而言,美國迪進國際在過去三年內的自由現金流實際上超過了EBIT。這種強勁的現金生成令我們感到欣慰,就像一隻穿着蜜蜂裝的小狗。
Our View
Our View
Happily, Digi International's impressive conversion of EBIT to free cash flow implies it has the upper hand on its debt. But, on a more sombre note, we are a little concerned by its interest cover. When we consider the range of factors above, it looks like Digi International is pretty sensible with its use of debt. That means they are taking on a bit more risk, in the hope of boosting shareholder returns. Of course, we wouldn't say no to the extra confidence that we'd gain if we knew that Digi International insiders have been buying shares: if you're on the same wavelength, you can find out if insiders are buying by clicking this link.
值得高興的是,美國迪進國際將EBIT轉化爲自由現金流的表現令人印象深刻,這意味着它在債務方面佔據上風。 但從另一個更嚴肅的角度看,我們有些擔心它的利息保障。 當我們考慮上述各種因素時,似乎美國迪進國際在使用債務方面相當審慎。這意味着他們承擔更多風險,希望能夠提升股東回報。 當然,如果我們知道美國迪進國際的內部人士在買入股票,我們會更加有信心:如果你也是同樣的想法,你可以通過點擊這個鏈接來查找內部人士是否在買入。
Of course, if you're the type of investor who prefers buying stocks without the burden of debt, then don't hesitate to discover our exclusive list of net cash growth stocks, today.
當然,如果你是那種喜歡在沒有債務負擔的情況下買入股票的投資者,那就不要猶豫,今天就來發現我們獨家的淨現金增長股票列表。
Have feedback on this article? Concerned about the content? Get in touch with us directly. Alternatively, email editorial-team (at) simplywallst.com.
This article by Simply Wall St is general in nature. We provide commentary based on historical data and analyst forecasts only using an unbiased methodology and our articles are not intended to be financial advice. It does not constitute a recommendation to buy or sell any stock, and does not take account of your objectives, or your financial situation. We aim to bring you long-term focused analysis driven by fundamental data. Note that our analysis may not factor in the latest price-sensitive company announcements or qualitative material. Simply Wall St has no position in any stocks mentioned.
對本文有反饋嗎?對內容有疑慮嗎?請直接與我們聯繫。或者,發送電子郵件至 editorial-team (at) simplywallst.com。
本文由Simply Wall ST撰寫,屬於一般性質。我們提供基於歷史數據和分析師預測的評論,僅使用無偏見的方法,我們的文章並不意圖提供財務建議。它不構成對買入或賣出任何股票的推薦,也未考慮您的目標或財務狀況。我們旨在提供基於基本數據的長期聚焦分析。請注意,我們的分析可能未考慮最新的價格敏感公司公告或定性材料。Simply Wall ST在提到的任何股票中沒有持倉。
譯文內容由第三人軟體翻譯。


 ,而今天在早盤衝高至24000附近入了熊仔后,指數大幅下跌最多接近6百多點,即時把昨日虧損賺回有突多

 ,而今天再破新高, 最高 24076 , 其後收市時轉跌約70點, 出了陰燭, 暫時走勢仍未有破壞, 不過由前底至今已經上漲接近至6千點, 本人覺得有貨者可以繼續持貨直到 明顯有走勢轉壞才止賺離場, 沒貨者可以等待回調后再上車, 其實本人也希望能夠快點有回調, 一來可以上車, 二來回一回氣也健康
 ,暫時看法都是跟之前一樣, 覺得即使有所回調應該都不會跌得太深,但假若期貨失守22350企不穩收,便可能還有下跌空間, 期貨短期要跌破21400的機會應該也不大, 所以本人覺得如果有大幅的回調也是一個機會分注做多。近日都堅持不過夜持倉,暫只做即市, 因為不高追,也不隨便做空。
支持阻力以現貨作參考
支持位 23150,23250,2...
評論(0)
請選擇舉報原因