


Gentherm (NASDAQ:THRM) Sheds US$59m, Company Earnings and Investor Returns Have Been Trending Downwards for Past Three Years
Gentherm (NASDAQ:THRM) Sheds US$59m, Company Earnings and Investor Returns Have Been Trending Downwards for Past Three Years
 During the three years that the share price fell, Gentherm's earnings per share (EPS) dropped by 9.3% each year. This reduction in EPS is slower than the 26% annual reduction in the share price. So it seems the market was too confident about the business, in the past.
If you love investing in stocks you're bound to buy some losers. But the last three years have been particularly tough on longer term Gentherm Incorporated (NASDAQ:THRM) shareholders. Sadly for them, the share price is down 59% in that time. And the ride hasn't got any smoother in recent times over the last year, with the price 44% lower in that time. Shareholders have had an even rougher run lately, with the share price down 28% in the last 90 days. We note that the company has reported results fairly recently; and the market is hardly delighted. You can check out the latest numbers in our company report.
如果你喜歡投資股票,必然會買到一些虧損的股票。但過去三年對於長線投資Gentherm公司(納斯達克:THRM)的股東來說特別艱難。不幸的是,在這段時間裏,股價下跌了59%。最近一年的情況也沒有好轉,股價下跌了44%。股東們最近經歷了更艱難的時光,在過去90天裏股價下跌了28%。我們注意到,該公司最近報告了業績;市場並不太滿意。你可以在我們的公司報告中查看最新的數字。
Given the past week has been tough on shareholders, let's investigate the fundamentals and see what we can learn.
鑑於過去一週對股東來說非常困難,讓我們來調查基本面,看看我們能學到什麼。
While markets are a powerful pricing mechanism, share prices reflect investor sentiment, not just underlying business performance. One flawed but reasonable way to assess how sentiment around a company has changed is to compare the earnings per share (EPS) with the share price.
雖然市場是一個強有力的定價機制,但股票價格反映了投資者情緒,而不僅僅是基本的業務表現。評估一家公司情緒變化的一個有缺陷但合理的方法是將每股收益(EPS)與股票價格進行比較。
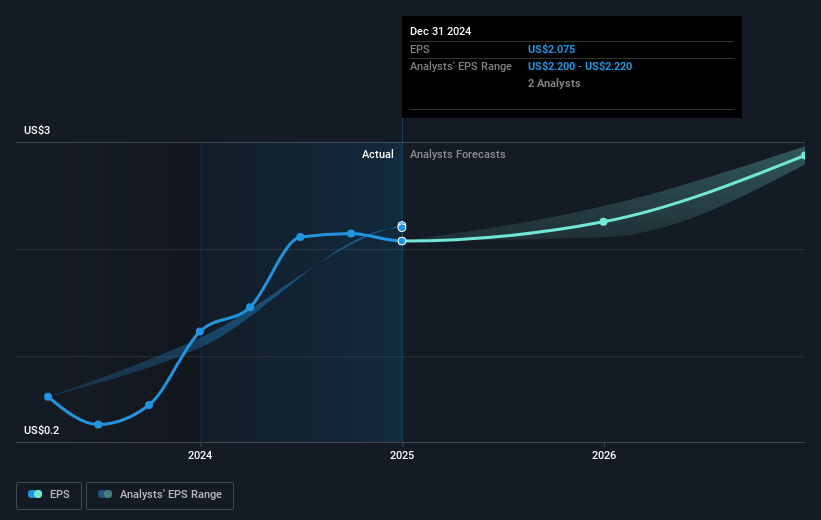
During the three years that the share price fell, Gentherm's earnings per share (EPS) dropped by 9.3% each year. This reduction in EPS is slower than the 26% annual reduction in the share price. So it seems the market was too confident about the business, in the past.
在股價下跌的三年中,Gentherm的每股收益(EPS)每年下降了9.3%。這一下降速度比股價年均減少26%要慢。因此,看起來市場對業務的信心在過去過於樂觀。
The graphic below depicts how EPS has changed over time (unveil the exact values by clicking on the image).
下面的圖表顯示了每股收益(EPS)是如何隨時間變化的(通過點擊圖像揭示確切的數值)。
We know that Gentherm has improved its bottom line lately, but is it going to grow revenue? You could check out this free report showing analyst revenue forecasts.
我們知道Gentherm最近改善了其利潤狀況,但它會增長營業收入嗎?你可以查看這份免費的報告,了解分析師的營業收入預測。
A Different Perspective
不同的視角
While the broader market gained around 8.2% in the last year, Gentherm shareholders lost 44%. Even the share prices of good stocks drop sometimes, but we want to see improvements in the fundamental metrics of a business, before getting too interested. Longer term investors wouldn't be so upset, since they would have made 0.5%, each year, over five years. If the fundamental data continues to indicate long term sustainable growth, the current sell-off could be an opportunity worth considering. If you would like to research Gentherm in more detail then you might want to take a look at whether insiders have been buying or selling shares in the company.
在過去一年,大盤上漲了約8.2%,而Gentherm的股東卻損失了44%。即使是表現良好的股票,有時股價也會下跌,但在我們對業務產生過多興趣之前,我們希望看到基本指標的改善。長期投資者可能不會太沮喪,因爲他們在五年中每年獲得了0.5%的收益。如果基本數據持續顯示長期的可持續增長,目前的拋售可能是一個值得考慮的機會。如果你想更詳細地研究Gentherm,那麼你可能想看看內部人士是否一直在買入或賣出公司的股票。
Of course Gentherm may not be the best stock to buy. So you may wish to see this free collection of growth stocks.
當然,Gentherm可能不是最佳的買入股票。因此,你可能希望查看這一免費的成長型股票合集。
Please note, the market returns quoted in this article reflect the market weighted average returns of stocks that currently trade on American exchanges.
請注意,本文中引用的市場回報反映了目前在美國交易所交易的股票的市場加權平均回報。
Have feedback on this article? Concerned about the content? Get in touch with us directly. Alternatively, email editorial-team (at) simplywallst.com.
This article by Simply Wall St is general in nature. We provide commentary based on historical data and analyst forecasts only using an unbiased methodology and our articles are not intended to be financial advice. It does not constitute a recommendation to buy or sell any stock, and does not take account of your objectives, or your financial situation. We aim to bring you long-term focused analysis driven by fundamental data. Note that our analysis may not factor in the latest price-sensitive company announcements or qualitative material. Simply Wall St has no position in any stocks mentioned.
對本文有反饋嗎?對內容有疑慮嗎?請直接與我們聯繫。或者,發送電子郵件至 editorial-team (at) simplywallst.com。
本文由Simply Wall ST撰寫,屬於一般性質。我們提供基於歷史數據和分析師預測的評論,僅使用無偏見的方法,我們的文章並不意圖提供財務建議。它不構成對買入或賣出任何股票的推薦,也未考慮您的目標或財務狀況。我們旨在提供基於基本數據的長期聚焦分析。請注意,我們的分析可能未考慮最新的價格敏感公司公告或定性材料。Simply Wall ST在提到的任何股票中沒有持倉。
譯文內容由第三人軟體翻譯。


 ,而今天在早盤衝高至24000附近入了熊仔后,指數大幅下跌最多接近6百多點,即時把昨日虧損賺回有突多

 ,而今天再破新高, 最高 24076 , 其後收市時轉跌約70點, 出了陰燭, 暫時走勢仍未有破壞, 不過由前底至今已經上漲接近至6千點, 本人覺得有貨者可以繼續持貨直到 明顯有走勢轉壞才止賺離場, 沒貨者可以等待回調后再上車, 其實本人也希望能夠快點有回調, 一來可以上車, 二來回一回氣也健康
 ,暫時看法都是跟之前一樣, 覺得即使有所回調應該都不會跌得太深,但假若期貨失守22350企不穩收,便可能還有下跌空間, 期貨短期要跌破21400的機會應該也不大, 所以本人覺得如果有大幅的回調也是一個機會分注做多。近日都堅持不過夜持倉,暫只做即市, 因為不高追,也不隨便做空。
支持阻力以現貨作參考
支持位 23150,23250,2...

評論(0)
請選擇舉報原因