Deep-pocketed investors have adopted a bullish approach towards Vistra (NYSE:VST), and it's something market players shouldn't ignore. Our tracking of public options records at Benzinga unveiled this significant move today. The identity of these investors remains unknown, but such a substantial move in VST usually suggests something big is about to happen.
We gleaned this information from our observations today when Benzinga's options scanner highlighted 11 extraordinary options activities for Vistra. This level of activity is out of the ordinary.
The general mood among these heavyweight investors is divided, with 36% leaning bullish and 36% bearish. Among these notable options, 7 are puts, totaling $844,269, and 4 are calls, amounting to $150,347.
Predicted Price Range
 After evaluating the trading volumes and Open Interest, it's evident that the major market movers are focusing on a price band between $125.0 and $155.0 for Vistra, spanning the last three months.
Insights into Volume & Open Interest
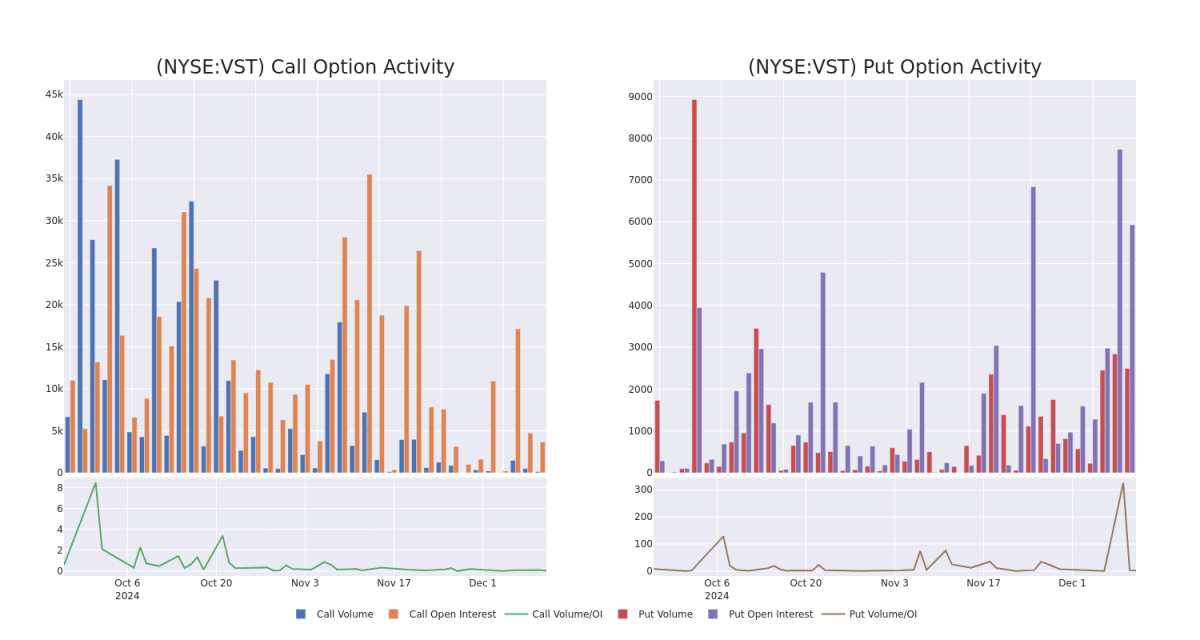
Examining the volume and open interest provides crucial insights into stock research. This information is key in gauging liquidity and interest levels for Vistra's options at certain strike prices. Below, we present a snapshot of the trends in volume and open interest for calls and puts across Vistra's significant trades, within a strike price range of $125.0 to $155.0, over the past month.
Vistra Option Activity Analysis: Last 30 Days
Biggest Options Spotted:
| Symbol | PUT/CALL | Trade Type | Sentiment | Exp. Date | Ask | Bid | Price | Strike Price | Total Trade Price | Open Interest | Volume |
|---|
| VST | PUT | SWEEP | NEUTRAL | 01/17/25 | $5.8 | $5.7 | $5.8 | $135.00 | $289.4K | 1.3K | 507 |
| VST | PUT | TRADE | BULLISH | 01/17/25 | $6.0 | $5.7 | $5.8 | $135.00 | $255.7K | 1.3K | 948 |
| VST | PUT | SWEEP | BEARISH | 12/20/24 | $12.7 | $12.7 | $12.7 | $155.00 | $106.6K | 708 | 85 |
| VST | PUT | SWEEP | BEARISH | 12/20/24 | $7.6 | $7.6 | $7.6 | $148.00 | $63.8K | 198 | 90 |
| VST | CALL | TRADE | BEARISH | 12/20/24 | $23.0 | $20.0 | $21.0 | $125.00 | $52.5K | 2.2K | 25 |
About Vistra
Vistra Energy is one of the largest power producers and retail energy providers in the us Following the 2024 Energy Harbor acquisition, Vistra owns 41 gigawatts of nuclear, coal, natural gas, and solar power generation along with one of the largest utility-scale battery projects in the world. Its retail electricity business serves 5 million customers in 20 states, including almost a third of all Texas electricity consumers. Vistra emerged from the Energy Future Holdings bankruptcy as a stand-alone entity in 2016. It acquired Dynegy in 2018.
Current Position of Vistra
- With a trading volume of 1,581,753, the price of VST is up by 2.92%, reaching $145.65.
- Current RSI values indicate that the stock is may be approaching overbought.
- Next earnings report is scheduled for 77 days from now.
What The Experts Say On Vistra
Over the past month, 1 industry analysts have shared their insights on this stock, proposing an average target price of $169.0.
Unusual Options Activity Detected: Smart Money on the Move
Benzinga Edge's Unusual Options board spots potential market movers before they happen. See what positions big money is taking on your favorite stocks. Click here for access.* Maintaining their stance, an analyst from Morgan Stanley continues to hold a Overweight rating for Vistra, targeting a price of $169.
Options are a riskier asset compared to just trading the stock, but they have higher profit potential. Serious options traders manage this risk by educating themselves daily, scaling in and out of trades, following more than one indicator, and following the markets closely.
財力雄厚的投資者對Vistra(紐約證券交易所代碼:VST)採取了看漲態度,這是市場參與者不容忽視的。我們對本辛加公開期權記錄的追蹤今天揭示了這一重大舉措。這些投資者的身份仍然未知,但是vST的如此實質性的變動通常表明重大事件即將發生。
我們今天從觀察中收集了這些信息,當時Benzinga的期權掃描儀重點介紹了瑞致達的11項非同尋常的期權活動。這種活動水平與衆不同。
這些重量級投資者的總體情緒存在分歧,36%的人傾向於看漲,36%的人傾向於看跌。在這些值得注意的期權中,有7個是看跌期權,總額爲844,269美元,4個是看漲期權,總額爲150,347美元。
預測的價格區間
 在評估了交易量和未平倉合約之後,很明顯,主要市場走勢者將注意力集中在瑞致達過去三個月的125.0美元至155.0美元之間的價格區間上。
對交易量和未平倉合約的見解
檢查交易量和未平倉合約爲股票研究提供了至關重要的見解。這些信息是衡量瑞致達期權在特定行使價下的流動性和利息水平的關鍵。下面,我們將簡要介紹過去一個月瑞致達重大交易的看漲期權和未平倉合約的趨勢,行使價區間爲125.0美元至155.0美元。
瑞致達期權活動分析:過去 30 天
發現的最大選擇:
符號 | 看跌/看漲 | 交易類型 | 情緒 | Exp。日期 | 問 | 出價 | 價格 | 行使價 | 總交易價格 | 未平倉合約 | 音量 |
|---|
VST | 放 | 掃 | 中立 | 01/17/25 | 5.8 美元 | 5.7 美元 | 5.8 美元 | 135.00 美元 | 289.4 萬美元 | 1.3K | 507 |
VST | 放 | 貿易 | 看漲 | 01/17/25 | 6.0 美元 | 5.7 美元 | 5.8 美元 | 135.00 美元 | 255.7 萬美元 | 1.3K | 948 |
VST | 放 | 掃 | 粗魯的 | 12/20/24 | 12.7 美元 | 12.7 美元 | 12.7 美元 | 155.00 美元 | 106.6 萬美元 | 708 | 85 |
VST | 放 | 掃 | 粗魯的 | 12/20/24 | 7.6 美元 | 7.6 美元 | 7.6 美元 | 148.00 美元 | 63.8 萬美元 | 198 | 90 |
VST | 打電話 | 貿易 | 粗魯的 | 12/20/24 | 23.0 美元 | 20.0 美元 | 21.0 美元 | 125.00 美元 | 52.5 萬美元 | 2.2K | 25 |
關於瑞致達
瑞致達能源是美國最大的電力生產商和零售能源提供商之一。繼2024年收購能源港之後,瑞致達擁有41千兆瓦的核能、煤炭、天然氣和太陽能發電,以及世界上最大的公用事業規模電池項目之一。其零售電力業務爲20個州的500萬客戶提供服務,其中包括德克薩斯州所有電力消費者的近三分之一。瑞致達於2016年從能源未來控股公司的破產中脫穎而出,成爲一家獨立的實體。它於2018年收購了戴尼基。
瑞致達目前的立場
專家對瑞致達的看法
在過去的一個月中,1位行業分析師分享了他們對該股的見解,提出平均目標價爲169.0美元。
檢測到不尋常的期權活動:智能貨幣在移動
Benzinga Edge的不尋常期權委員會在潛在的市場推動者發生之前就發現了它們。看看大筆資金對你最喜歡的股票持有哪些頭寸。點擊此處查看。* 摩根士丹利的一位分析師維持其立場,繼續維持瑞致達的增持評級,目標價爲169美元。
與僅交易股票相比,期權是一種風險更高的資產,但它們具有更高的盈利潛力。嚴肅的期權交易者通過每天進行自我教育、擴大交易規模、遵循多個指標以及密切關注市場來管理這種風險。