
Hewlett Packard Enterprise's (NYSE:HPE) Earnings Growth Rate Lags the 15% CAGR Delivered to Shareholders
Hewlett Packard Enterprise's (NYSE:HPE) Earnings Growth Rate Lags the 15% CAGR Delivered to Shareholders
 Hewlett Packard Enterprise was able to grow its EPS at 22% per year over three years, sending the share price higher. This EPS growth is higher than the 12% average annual increase in the share price. Therefore, it seems the market has moderated its expectations for growth, somewhat.
 One simple way to benefit from the stock market is to buy an index fund. But if you buy good businesses at attractive prices, your portfolio returns could exceed the average market return. Just take a look at Hewlett Packard Enterprise Company (NYSE:HPE), which is up 40%, over three years, soundly beating the market return of 25% (not including dividends). However, more recent returns haven't been as impressive as that, with the stock returning just 29% in the last year, including dividends.
從股票市場獲利的一個簡單方法就是購買指數基金。但是,如果您以有吸引力的價格買入優質企業,您的投資組合回報可能超過平均市場回報。只需看看紐交所(NYSE)上的慧與科技公司(HPE),在三年內上漲了40%,遠遠超過了25%的市場回報(不包括分紅)。然而,最近的回報並不像那樣令人印象深刻,該股票在過去一年僅回報29%,包括分紅在內。
Since the long term performance has been good but there's been a recent pullback of 4.0%, let's check if the fundamentals match the share price.
由於長期表現良好,但最近出現了4.0%的回調,請檢查基本面是否與股價相匹配。
While the efficient markets hypothesis continues to be taught by some, it has been proven that markets are over-reactive dynamic systems, and investors are not always rational. By comparing earnings per share (EPS) and share price changes over time, we can get a feel for how investor attitudes to a company have morphed over time.
儘管一些人繼續教授有效市場假說,但已經證明市場是過度反應的動態系統,並且投資者並不總是理性的。通過比較每股收益(EPS)和股價的變化情況,我們可以了解投資者對公司的態度如何隨着時間變化而變化。
Hewlett Packard Enterprise was able to grow its EPS at 22% per year over three years, sending the share price higher. This EPS growth is higher than the 12% average annual increase in the share price. Therefore, it seems the market has moderated its expectations for growth, somewhat.
慧與科技公司(HPE)在過去三年裏,每年EPS增長22%,推動股價上升。這種每股收益的增長高於股價平均年增長率的12%。因此,市場似乎在一定程度上調整了對增長的期望。
The image below shows how EPS has tracked over time (if you click on the image you can see greater detail).
下圖顯示了EPS隨時間的變化情況(如果您單擊該圖像,則可以查看更多詳細信息)。
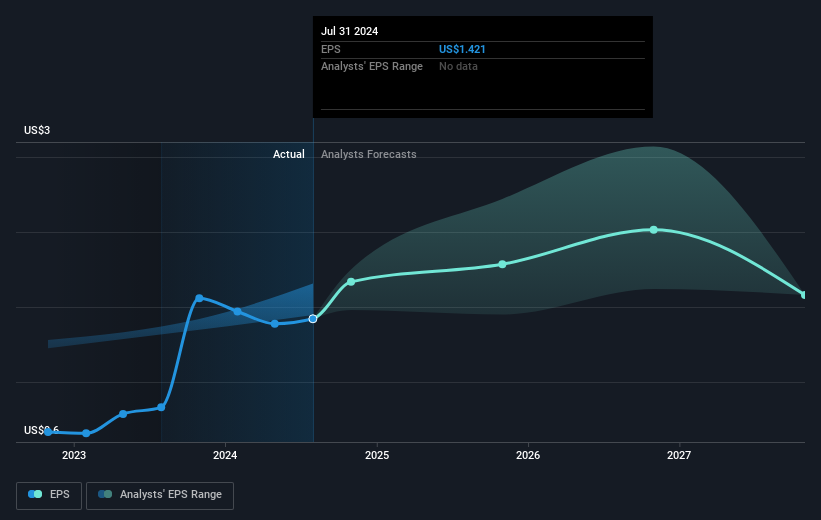
We know that Hewlett Packard Enterprise has improved its bottom line lately, but is it going to grow revenue? You could check out this free report showing analyst revenue forecasts.
我們知道慧與科技最近改善了底線,但它將增加營業收入嗎?您可以查看這份顯示分析師營業收入預測的免費報告。
What About Dividends?
關於分紅派息的問題
As well as measuring the share price return, investors should also consider the total shareholder return (TSR). The TSR is a return calculation that accounts for the value of cash dividends (assuming that any dividend received was reinvested) and the calculated value of any discounted capital raisings and spin-offs. Arguably, the TSR gives a more comprehensive picture of the return generated by a stock. We note that for Hewlett Packard Enterprise the TSR over the last 3 years was 53%, which is better than the share price return mentioned above. This is largely a result of its dividend payments!
除了衡量股價回報之外,投資者還應考慮股東總回報(TSR)。TSR是一種回報計算,考慮了現金分紅的價值(假設任何收到的分紅都是再投資的)以及任何折現的增資和剝離的計算價值。可以說,TSR能更全面地反映股票生成的回報。我們注意到,慧與科技過去3年的TSR爲53%,比上述股價回報要好。這在很大程度上是其分紅支付的結果!
A Different Perspective
另一種看法
Hewlett Packard Enterprise shareholders gained a total return of 29% during the year. But that was short of the market average. On the bright side, that's still a gain, and it's actually better than the average return of 10% over half a decade This suggests the company might be improving over time. I find it very interesting to look at share price over the long term as a proxy for business performance. But to truly gain insight, we need to consider other information, too. Even so, be aware that Hewlett Packard Enterprise is showing 1 warning sign in our investment analysis , you should know about...
慧與科技股東在該年獲得了29%的總回報。但這還不及市場平均水平。好消息是,這仍然是一筆收益,並且實際上比過去半個世紀的10%的平均回報要好。這表明公司可能隨着時間的推移正在改善。我覺得長期觀察股價作爲業務績效的一種代理很有趣。但要真正獲取洞察,我們也需要考慮其他信息。儘管如此,請注意,慧與科技在我們的投資分析中出現了1個警告標誌,您應該了解一下...
If you are like me, then you will not want to miss this free list of undervalued small caps that insiders are buying.
如果您和我一樣,那麼您一定不想錯過這份免費的被內部人員買入的低估小盤股清單。
Please note, the market returns quoted in this article reflect the market weighted average returns of stocks that currently trade on American exchanges.
請注意,本文所引述的市場回報反映了目前在美國交易所上市的股票的市場加權平均回報。
Have feedback on this article? Concerned about the content? Get in touch with us directly. Alternatively, email editorial-team (at) simplywallst.com.
This article by Simply Wall St is general in nature. We provide commentary based on historical data and analyst forecasts only using an unbiased methodology and our articles are not intended to be financial advice. It does not constitute a recommendation to buy or sell any stock, and does not take account of your objectives, or your financial situation. We aim to bring you long-term focused analysis driven by fundamental data. Note that our analysis may not factor in the latest price-sensitive company announcements or qualitative material. Simply Wall St has no position in any stocks mentioned.
對這篇文章有反饋嗎?對內容感到擔憂嗎?請直接與我們聯繫。或者,發送電子郵件至editorial-team @ simplywallst.com。
Simply Wall St的這篇文章是一般性質的。我們僅基於歷史數據和分析師預測提供評論,使用公正的方法,我們的文章並非意在提供財務建議。這並不構成買入或賣出任何股票的建議,並且不考慮您的目標或財務狀況。我們旨在爲您帶來基於基礎數據驅動的長期聚焦分析。請注意,我們的分析可能未考慮最新的價格敏感公司公告或定性材料。Simply Wall St對提及的任何股票都沒有持倉。
譯文內容由第三人軟體翻譯。
