
ICON (NASDAQ:ICLR) Sheds 3.0% This Week, as Yearly Returns Fall More in Line With Earnings Growth
ICON (NASDAQ:ICLR) Sheds 3.0% This Week, as Yearly Returns Fall More in Line With Earnings Growth
 Over half a decade, ICON managed to grow its earnings per share at 6.2% a year. This EPS growth is reasonably close to the 7% average annual increase in the share price. That suggests that the market sentiment around the company hasn't changed much over that time. Rather, the share price has approximately tracked EPS growth.
 The last three months have been tough on ICON Public Limited Company (NASDAQ:ICLR) shareholders, who have seen the share price decline a rather worrying 34%. But at least the stock is up over the last five years. Unfortunately its return of 38% is below the market return of 108%.
過去三個月對納斯達克icon有限公司(NASDAQ:ICLR)股東來說很艱難,股價下跌了34%,令人擔憂。但至少股票在過去五年裏上漲了。不幸的是,其38%的回報低於市場回報的108%。
Since the long term performance has been good but there's been a recent pullback of 3.0%, let's check if the fundamentals match the share price.
由於長期表現不錯,但最近出現了3.0%的回落,讓我們檢查一下基本面是否與股價匹配。
While markets are a powerful pricing mechanism, share prices reflect investor sentiment, not just underlying business performance. One flawed but reasonable way to assess how sentiment around a company has changed is to compare the earnings per share (EPS) with the share price.
雖然市場是一個強大的定價機制,但股價反映了投資者情緒,不僅僅是基本業績。一種有缺陷但合理的評估公司周圍情緒如何變化的方法是將每股收益(EPS)與股價進行比較。
Over half a decade, ICON managed to grow its earnings per share at 6.2% a year. This EPS growth is reasonably close to the 7% average annual increase in the share price. That suggests that the market sentiment around the company hasn't changed much over that time. Rather, the share price has approximately tracked EPS growth.
在過去的五年裏,icon每股收益以6.2%的年增長率增長。這種EPS增長與股價的7%的年均增長接近。這表明市場對該公司的情緒在這段時間內並沒有發生太大變化。相反,股價大致跟蹤了每股收益的增長。
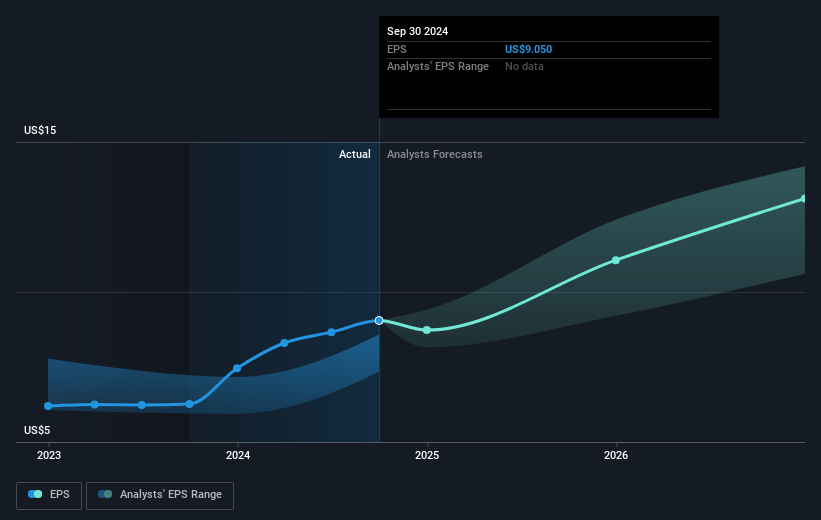
You can see below how EPS has changed over time (discover the exact values by clicking on the image).
您可以看到EPS隨時間的變化如下(通過單擊圖像了解確切數值)。
We're pleased to report that the CEO is remunerated more modestly than most CEOs at similarly capitalized companies. But while CEO remuneration is always worth checking, the really important question is whether the company can grow earnings going forward. This free interactive report on ICON's earnings, revenue and cash flow is a great place to start, if you want to investigate the stock further.
我們很高興地報告,該CEO的報酬比大多數同等資本化的公司的CEO都要適度。但是,儘管CEO的報酬值得檢查,但真正重要的問題是公司未來能否增長收益。如果您想進一步調查股票,ICON的收益、營業收入和現金流的這份免費互動報告是一個很好的起點。
A Different Perspective
另一種看法
While the broader market gained around 39% in the last year, ICON shareholders lost 17%. Even the share prices of good stocks drop sometimes, but we want to see improvements in the fundamental metrics of a business, before getting too interested. Longer term investors wouldn't be so upset, since they would have made 7%, each year, over five years. It could be that the recent sell-off is an opportunity, so it may be worth checking the fundamental data for signs of a long term growth trend. Before deciding if you like the current share price, check how ICON scores on these 3 valuation metrics.
雖然過去一年更廣泛的市場上漲了大約39%,ICON的股東卻損失了17%。即使好股票的股價有時也會下跌,但我們希望在對一家企業的基本指標進行改善之前不要過於感興趣。長期投資者可能不會那麼沮喪,因爲在過去五年中,他們每年都會獲利7%。最近的拋售可能是一個機會,因此值得檢查基本數據,以尋找長期增長趨勢的跡象。在決定是否喜歡當前股價之前,請檢查ICON在這3個估值指標上的得分。
But note: ICON may not be the best stock to buy. So take a peek at this free list of interesting companies with past earnings growth (and further growth forecast).
但請注意:ICON可能不是最好的股票買入選擇。因此,瀏覽這份過去收益增長和未來增長預測的有趣公司的免費清單。
Please note, the market returns quoted in this article reflect the market weighted average returns of stocks that currently trade on American exchanges.
請注意,本文所引述的市場回報反映了目前在美國交易所上市的股票的市場加權平均回報。
Have feedback on this article? Concerned about the content? Get in touch with us directly. Alternatively, email editorial-team (at) simplywallst.com.
This article by Simply Wall St is general in nature. We provide commentary based on historical data and analyst forecasts only using an unbiased methodology and our articles are not intended to be financial advice. It does not constitute a recommendation to buy or sell any stock, and does not take account of your objectives, or your financial situation. We aim to bring you long-term focused analysis driven by fundamental data. Note that our analysis may not factor in the latest price-sensitive company announcements or qualitative material. Simply Wall St has no position in any stocks mentioned.
對這篇文章有反饋嗎?對內容感到擔憂嗎?請直接與我們聯繫。或者,發送電子郵件至editorial-team @ simplywallst.com。
Simply Wall St的這篇文章是一般性質的。我們僅基於歷史數據和分析師預測提供評論,使用公正的方法,我們的文章並非意在提供財務建議。這並不構成買入或賣出任何股票的建議,並且不考慮您的目標或財務狀況。我們旨在爲您帶來基於基礎數據驅動的長期聚焦分析。請注意,我們的分析可能未考慮最新的價格敏感公司公告或定性材料。Simply Wall St對提及的任何股票都沒有持倉。
譯文內容由第三人軟體翻譯。
