
Group 1 Automotive (NYSE:GPI) Sheds 4.0% This Week, as Yearly Returns Fall More in Line With Earnings Growth
Group 1 Automotive (NYSE:GPI) Sheds 4.0% This Week, as Yearly Returns Fall More in Line With Earnings Growth
 Over half a decade, Group 1 Automotive managed to grow its earnings per share at 39% a year. This EPS growth is higher than the 29% average annual increase in the share price. So one could conclude that the broader market has become more cautious towards the stock. The reasonably low P/E ratio of 8.41 also suggests market apprehension.
 The most you can lose on any stock (assuming you don't use leverage) is 100% of your money. But on the bright side, if you buy shares in a high quality company at the right price, you can gain well over 100%. For instance, the price of Group 1 Automotive, Inc. (NYSE:GPI) stock is up an impressive 253% over the last five years. In contrast, the stock has fallen 8.9% in the last 30 days.
您在任何股票上最多可能失去的金額(假設您不使用槓桿)是您的資金的100%。但從好的方面來看,如果您以合適的價格買入高質量公司的股票,您可以獲得超過100%的收益。例如,汽車一組股票在過去五年中飆升了驚人的253%。相比之下,該股票在過去30天內下跌了8.9%。
In light of the stock dropping 4.0% in the past week, we want to investigate the longer term story, and see if fundamentals have been the driver of the company's positive five-year return.
鑑於股價在過去一週下跌了4.0%,我們想調查更長期的情況,看看基本面是否是公司五年來積極表現的推動因素。
While markets are a powerful pricing mechanism, share prices reflect investor sentiment, not just underlying business performance. By comparing earnings per share (EPS) and share price changes over time, we can get a feel for how investor attitudes to a company have morphed over time.
儘管市場是一個強大的定價機制,股價不僅反映了基本業務表現,還反映了投資者的情緒。通過比較每股收益(EPS)和股價變化,並隨時間推移這樣做,我們可以了解股東對公司的態度如何隨時間變化。
Over half a decade, Group 1 Automotive managed to grow its earnings per share at 39% a year. This EPS growth is higher than the 29% average annual increase in the share price. So one could conclude that the broader market has become more cautious towards the stock. The reasonably low P/E ratio of 8.41 also suggests market apprehension.
在半個多世紀的時間裏,汽車一組設法將每股收益增長率維持在39%。這種每股收益增長高於29%的股價年均增幅。因此,可以得出結論稱,更廣泛的市場對該股持有更加謹慎態度。相對較低的市盈率8.41也顯示市場的憂慮。
The image below shows how EPS has tracked over time (if you click on the image you can see greater detail).
下圖顯示了EPS隨時間的變化情況(如果您單擊該圖像,則可以查看更多詳細信息)。
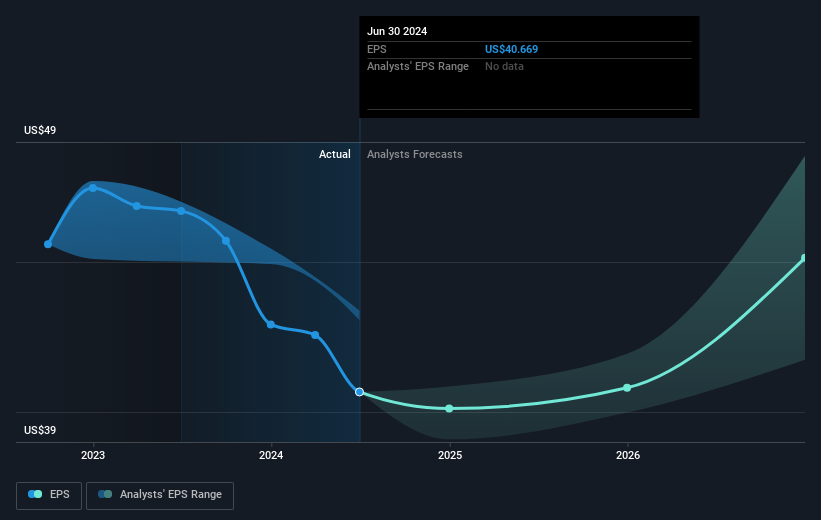
Dive deeper into Group 1 Automotive's key metrics by checking this interactive graph of Group 1 Automotive's earnings, revenue and cash flow.
通過查看汽車一組的盈利、營業收入和現金流的互動圖表,深入了解汽車一組的關鍵指標。
What About Dividends?
那麼分紅怎麼樣呢?
As well as measuring the share price return, investors should also consider the total shareholder return (TSR). The TSR is a return calculation that accounts for the value of cash dividends (assuming that any dividend received was reinvested) and the calculated value of any discounted capital raisings and spin-offs. Arguably, the TSR gives a more comprehensive picture of the return generated by a stock. As it happens, Group 1 Automotive's TSR for the last 5 years was 266%, which exceeds the share price return mentioned earlier. And there's no prize for guessing that the dividend payments largely explain the divergence!
除了衡量股價回報外,投資者還應考慮總股東回報(TSR)。TSR是考慮到現金分紅價值(假設收到的任何股息都被再投資)以及任何折扣後的資本增發和分拆價值的回報計算。可以說,TSR提供了更全面的股票回報圖片。事實上,汽車一組過去5年的TSR爲266%,超過前面提到的股價回報。毫無疑問,股息支付在很大程度上解釋了這種分歧!
A Different Perspective
不同的觀點
Group 1 Automotive provided a TSR of 41% over the year (including dividends). That's fairly close to the broader market return. Most would be happy with a gain, and it helps that the year's return is actually better than the average return over five years, which was 30%. It is possible that management foresight will bring growth well into the future, even if the share price slows down. While it is well worth considering the different impacts that market conditions can have on the share price, there are other factors that are even more important. For example, we've discovered 2 warning signs for Group 1 Automotive (1 shouldn't be ignored!) that you should be aware of before investing here.
汽車一組在今年提供了41%的TSR(包括股息)。這與更廣泛的市場回報相當接近。大多數人會爲獲利而高興,而且今年的回報實際上比過去五年的平均回報(爲30%)更好,這是有幫助的。有可能,管理的遠見將帶來未來的增長,即使股價放緩。雖然考慮市場條件對股價的不同影響是值得的,但還有其他更重要的因素。例如,我們發現了汽車一組的2個警示信號(一個不應被忽視!)在投資之前,您應該注意這些。
If you would prefer to check out another company -- one with potentially superior financials -- then do not miss this free list of companies that have proven they can grow earnings.
如果您願意查看另一家公司(具有潛在的更好財務狀況),請不要錯過這個免費的公司列表,證明它們可以增長收益。
Please note, the market returns quoted in this article reflect the market weighted average returns of stocks that currently trade on American exchanges.
請注意,本文所引述的市場回報反映了目前在美國交易所上市的股票的市場加權平均回報。
Have feedback on this article? Concerned about the content? Get in touch with us directly. Alternatively, email editorial-team (at) simplywallst.com.
This article by Simply Wall St is general in nature. We provide commentary based on historical data and analyst forecasts only using an unbiased methodology and our articles are not intended to be financial advice. It does not constitute a recommendation to buy or sell any stock, and does not take account of your objectives, or your financial situation. We aim to bring you long-term focused analysis driven by fundamental data. Note that our analysis may not factor in the latest price-sensitive company announcements or qualitative material. Simply Wall St has no position in any stocks mentioned.
對本文有任何反饋?對內容有任何疑慮?請直接與我們聯繫。或者,發送電子郵件至editorial-team@simplywallst.com。
這篇文章是Simply Wall St的一般性文章。我們根據歷史數據和分析師預測提供評論,只使用公正的方法論,我們的文章並不意味着提供任何金融建議。文章不構成買賣任何股票的建議,也不考慮您的目標或您的財務狀況。我們的目標是帶給您基本數據驅動的長期關注分析。請注意,我們的分析可能不考慮最新的價格敏感公司公告或定性材料。Simply Wall St沒有任何股票頭寸。
譯文內容由第三人軟體翻譯。
