
Oddity Tech (NASDAQ:ODD) Is Very Good At Capital Allocation
Oddity Tech (NASDAQ:ODD) Is Very Good At Capital Allocation
 0.31 = US$122m ÷ (US$519m - US$131m)
 What trends should we look for it we want to identify stocks that can multiply in value over the long term? Ideally, a business will show two trends; firstly a growing return on capital employed (ROCE) and secondly, an increasing amount of capital employed. Basically this means that a company has profitable initiatives that it can continue to reinvest in, which is a trait of a compounding machine. So when we looked at the ROCE trend of Oddity Tech (NASDAQ:ODD) we really liked what we saw.
如果我們想要找到長期能夠增值的股票,我們應該關注哪些趨勢呢?理想情況下,一家企業會展現出兩個趨勢;首先是不斷增長的資本僱用回報率(ROCE),其次是不斷增加的資本僱用量。基本上這意味着一家公司具有盈利的舉措,並可以繼續投資,這是一個compound的特徵。因此,當我們看到Oddity Tech(納斯達克:ODD)的ROCE趨勢時,我們真的很喜歡我們所看到的。
Understanding Return On Capital Employed (ROCE)
上面您可以看到蒙托克可再生能源現行ROCE與之前資本回報的比較,但過去只能知道這麼多。如果您感興趣,可以查看我們免費的蒙托克可再生能源分析師報告,了解分析師的預測。
If you haven't worked with ROCE before, it measures the 'return' (pre-tax profit) a company generates from capital employed in its business. Analysts use this formula to calculate it for Oddity Tech:
如果您以前沒有接觸過ROCE,它衡量一家公司從其業務中資本僱用所產生的'回報'(稅前利潤)。分析師使用這個公式爲Oddity Tech計算它:
Return on Capital Employed = Earnings Before Interest and Tax (EBIT) ÷ (Total Assets - Current Liabilities)
資產僱用回報率(ROCE)是指企業利潤,即企業稅前利潤除以企業投入的總資本(負債加股權)。如果ROCE高於企業財務成本的承受能力,那麼企業就會創造出更多的價值。
0.31 = US$122m ÷ (US$519m - US$131m) (Based on the trailing twelve months to June 2024).
0.31 = 12200萬美元 ÷(51900萬美元 - 1.31億美元)(截至2024年6月止的過去十二個月)。
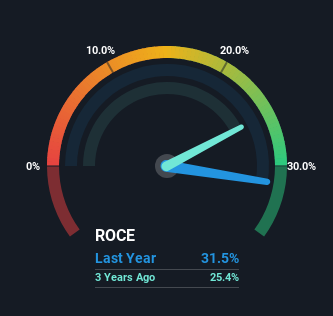
Therefore, Oddity Tech has an ROCE of 31%. That's a fantastic return and not only that, it outpaces the average of 15% earned by companies in a similar industry.
因此,Oddity Tech的ROCE爲31%。這是一個很棒的回報,不僅如此,它超過了同行業公司平均15%的回報。
Above you can see how the current ROCE for Oddity Tech compares to its prior returns on capital, but there's only so much you can tell from the past. If you're interested, you can view the analysts predictions in our free analyst report for Oddity Tech .
您可以看到當前奇技公司的資本回報率(ROCE)與之前的資本回報率相比,但從過去中能得到的信息有限。如果您感興趣,您可以查看我們爲奇技公司提供的免費分析師報告中的分析師預測。
What Can We Tell From Oddity Tech's ROCE Trend?
從奇技公司的ROCE趨勢中我們能得出什麼結論?
Investors would be pleased with what's happening at Oddity Tech. The numbers show that in the last three years, the returns generated on capital employed have grown considerably to 31%. The amount of capital employed has increased too, by 445%. The increasing returns on a growing amount of capital is common amongst multi-baggers and that's why we're impressed.
投資者對奇技公司發生的事情應該感到高興。數據顯示,在過去三年中,資本利用率產生的回報顯著增長至31%。使用的資本數量也增加了445%。在不斷增長的資本數量上獲得增長的回報在多倍股中很常見,這也是爲什麼我們印象深刻的原因。
In another part of our analysis, we noticed that the company's ratio of current liabilities to total assets decreased to 25%, which broadly means the business is relying less on its suppliers or short-term creditors to fund its operations. So shareholders would be pleased that the growth in returns has mostly come from underlying business performance.
在我們分析的另一部分中,我們注意到公司的流動負債與總資產的比率下降至25%,這基本上意味着業務在資金計劃中更少依賴於供應商或短期債權人。因此,股東應該高興地看到回報增長大部分來自基礎業績。
The Key Takeaway
重要提示
In summary, it's great to see that Oddity Tech can compound returns by consistently reinvesting capital at increasing rates of return, because these are some of the key ingredients of those highly sought after multi-baggers. And investors seem to expect more of this going forward, since the stock has rewarded shareholders with a 39% return over the last year. Therefore, we think it would be worth your time to check if these trends are going to continue.
總而言之,看到奇技公司能夠通過持續以遞增的回報率再投資資本來複利,真是令人高興,因爲這些是備受追捧的多倍股的關鍵要素之一。而且投資者似乎期待着未來會有更多這樣的情況,因爲該股票在過去一年中爲股東帶來了39%的回報。因此,我們認爲值得您花時間去查看這些趨勢是否會持續。
Before jumping to any conclusions though, we need to know what value we're getting for the current share price. That's where you can check out our FREE intrinsic value estimation for ODD that compares the share price and estimated value.
在得出任何結論之前,我們需要知道我們當前的股價定價是多少。您可以查看我們免費的內在價值估算工具,該工具可以比較股價和估算價值。
If you want to search for more stocks that have been earning high returns, check out this free list of stocks with solid balance sheets that are also earning high returns on equity.
如果您想尋找更多獲得高回報的股票,請查看這個免費股票列表,這些股票不僅有紮實的資產負債表,而且還有高回報率。
Have feedback on this article? Concerned about the content? Get in touch with us directly. Alternatively, email editorial-team (at) simplywallst.com.
This article by Simply Wall St is general in nature. We provide commentary based on historical data and analyst forecasts only using an unbiased methodology and our articles are not intended to be financial advice. It does not constitute a recommendation to buy or sell any stock, and does not take account of your objectives, or your financial situation. We aim to bring you long-term focused analysis driven by fundamental data. Note that our analysis may not factor in the latest price-sensitive company announcements or qualitative material. Simply Wall St has no position in any stocks mentioned.
對本文有任何反饋?對內容有任何疑慮?請直接與我們聯繫。或者,發送電子郵件至editorial-team@simplywallst.com。
這篇文章是Simply Wall St的一般性文章。我們根據歷史數據和分析師預測提供評論,只使用公正的方法論,我們的文章並不意味着提供任何金融建議。文章不構成買賣任何股票的建議,也不考慮您的目標或您的財務狀況。我們的目標是帶給您基本數據驅動的長期關注分析。請注意,我們的分析可能不考慮最新的價格敏感公司公告或定性材料。Simply Wall St沒有任何股票頭寸。
譯文內容由第三人軟體翻譯。
