
Does NXP Semiconductors (NASDAQ:NXPI) Have A Healthy Balance Sheet?
Does NXP Semiconductors (NASDAQ:NXPI) Have A Healthy Balance Sheet?
 According to the last reported balance sheet, NXP Semiconductors had liabilities of US$3.11b due within 12 months, and liabilities of US$10.7b due beyond 12 months. On the other hand, it had cash of US$3.26b and US$927.0m worth of receivables due within a year. So its liabilities total US$9.67b more than the combination of its cash and short-term receivables.
 Legendary fund manager Li Lu (who Charlie Munger backed) once said, 'The biggest investment risk is not the volatility of prices, but whether you will suffer a permanent loss of capital.' When we think about how risky a company is, we always like to look at its use of debt, since debt overload can lead to ruin. We note that NXP Semiconductors N.V. (NASDAQ:NXPI) does have debt on its balance sheet. But the real question is whether this debt is making the company risky.
傳奇基金經理李錄(得到查理·芒格支持)曾經說過,「最大的投資風險不是價格的波動,而是你是否會遭受到資本的永久損失。」 當我們考慮一家公司有多冒險時,我們總是喜歡看它的債務使用情況,因爲債務過載可能會導致滅頂之災。我們注意到恩智浦半導體(納斯達克代碼:NXPI)的資產負債表上確實有債務。但真正的問題是,這筆債務是否會讓公司變得更加冒險。
When Is Debt A Problem?
什麼時候負債才是一個問題?
Debt assists a business until the business has trouble paying it off, either with new capital or with free cash flow. In the worst case scenario, a company can go bankrupt if it cannot pay its creditors. However, a more common (but still painful) scenario is that it has to raise new equity capital at a low price, thus permanently diluting shareholders. Having said that, the most common situation is where a company manages its debt reasonably well - and to its own advantage. The first thing to do when considering how much debt a business uses is to look at its cash and debt together.
債務可以幫助業務,直到業務遇到償還困難爲止,無論是通過新資本還是通過自由現金流。在最壞的情況下,如果一家公司無法償還債權人,它可能會破產。然而,一個更常見(但仍然痛苦)的情況是,公司不得不以低價籌集新的股本,從而永久性地稀釋股東的利益。說到這一點,最常見的情況是公司合理管理其債務-並將其利益化。在考慮一家企業使用了多少債務時,首先要做的是結合現金和債務一起看。
What Is NXP Semiconductors's Net Debt?
恩智浦半導體的淨債務是多少?
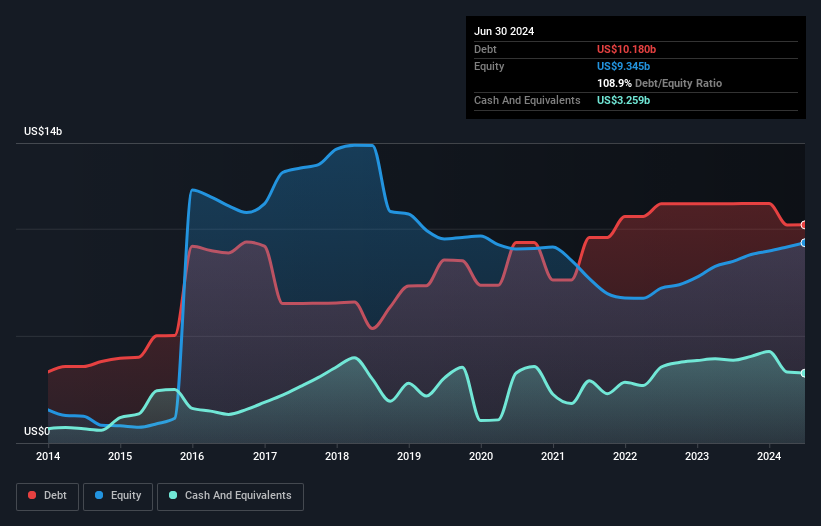
As you can see below, NXP Semiconductors had US$10.2b of debt at June 2024, down from US$11.2b a year prior. However, because it has a cash reserve of US$3.26b, its net debt is less, at about US$6.92b.
正如您所看到的,恩智浦半導體在2024年6月的債務爲102億美元,比上一年的112億美元有所下降。然而,由於其現金儲備爲32.6億美元,其淨債務較少,約爲69.2億美元。
A Look At NXP Semiconductors' Liabilities
恩智浦半導體負債情況一覽
According to the last reported balance sheet, NXP Semiconductors had liabilities of US$3.11b due within 12 months, and liabilities of US$10.7b due beyond 12 months. On the other hand, it had cash of US$3.26b and US$927.0m worth of receivables due within a year. So its liabilities total US$9.67b more than the combination of its cash and short-term receivables.
根據最新披露的資產負債表,恩智浦半導體的負債中,在十二個月內到期的爲31.1億美元,超過十二個月到期的爲107億美元。另一方面,其現金爲32.6億美元,應收賬款爲9億2700萬美元。因此,其負債總額比其現金和短期應收賬款的組合高96.7億美元。
Given NXP Semiconductors has a humongous market capitalization of US$59.5b, it's hard to believe these liabilities pose much threat. But there are sufficient liabilities that we would certainly recommend shareholders continue to monitor the balance sheet, going forward.
考慮到恩智浦半導體的龐大市值爲595億美元,很難相信這些負債會構成威脅。但存在足夠的負債,我們肯定建議股東繼續關注資產負債表的動向。
In order to size up a company's debt relative to its earnings, we calculate its net debt divided by its earnings before interest, tax, depreciation, and amortization (EBITDA) and its earnings before interest and tax (EBIT) divided by its interest expense (its interest cover). This way, we consider both the absolute quantum of the debt, as well as the interest rates paid on it.
爲了比較一個公司的債務與其收益的關係,我們計算其淨債務除以利息、稅、折舊和攤銷前的收益和利息前的收益(其利息覆蓋率)。因此,我們考慮了債務的絕對數量以及支付的利率。
NXP Semiconductors has a low net debt to EBITDA ratio of only 1.5. And its EBIT covers its interest expense a whopping 16.3 times over. So we're pretty relaxed about its super-conservative use of debt. NXP Semiconductors's EBIT was pretty flat over the last year, but that shouldn't be an issue given the it doesn't have a lot of debt. When analysing debt levels, the balance sheet is the obvious place to start. But ultimately the future profitability of the business will decide if NXP Semiconductors can strengthen its balance sheet over time. So if you want to see what the professionals think, you might find this free report on analyst profit forecasts to be interesting.
恩智浦半導體的淨債務與EBITDA比率僅爲1.5。其EBIT覆蓋其利息支出高達16.3倍。因此,我們對其極度保守的債務使用感到放心。 恩智浦半導體的EBIT在過去一年中基本平穩,但鑑於其沒有太多債務,這不應該成爲問題。 在分析債務水平時,資產負債表是明顯的起點。但最終,企業未來的盈利能力將決定恩智浦半導體是否能隨着時間加強其資產負債表。 因此,如果您想了解專業人士的觀點,您可能會發現分析師盈利預測的這份免費報告很有趣。
Finally, a company can only pay off debt with cold hard cash, not accounting profits. So we clearly need to look at whether that EBIT is leading to corresponding free cash flow. Over the most recent three years, NXP Semiconductors recorded free cash flow worth 69% of its EBIT, which is around normal, given free cash flow excludes interest and tax. This free cash flow puts the company in a good position to pay down debt, when appropriate.
最後,一家公司只能用現金來償還債務,而不是會計利潤。因此,我們明顯需要看一下EBIT是否導致相應的自由現金流。 在過去三年中,恩智浦半導體記錄的自由現金流價值相當於其EBIT的69%,這是正常水平,因爲自由現金流不包括利息和稅費。 這份自由現金流使公司在適當時期償還債務處於良好位置。
Our View
我們的觀點
Happily, NXP Semiconductors's impressive interest cover implies it has the upper hand on its debt. And the good news does not stop there, as its conversion of EBIT to free cash flow also supports that impression! When we consider the range of factors above, it looks like NXP Semiconductors is pretty sensible with its use of debt. That means they are taking on a bit more risk, in the hope of boosting shareholder returns. When analysing debt levels, the balance sheet is the obvious place to start. But ultimately, every company can contain risks that exist outside of the balance sheet. To that end, you should be aware of the 2 warning signs we've spotted with NXP Semiconductors .
令人欣慰的是,恩智浦出色的利息支付覆蓋率意味着它在債務方面具有優勢。好消息還不止於此,因爲其將EBIT轉化爲自由現金流的能力也支持這一印象!當我們考慮上述因素範圍時,恩智浦在債務使用上顯得相當明智。這意味着他們正在承擔更多風險,希望提高股東回報。在分析債務水平時,資產負債表是明顯的起點。但最終,每家公司都可能存在超越資產負債表以外的風險。因此,您應該注意我們發現的關於恩智浦的2個警示信號。
When all is said and done, sometimes its easier to focus on companies that don't even need debt. Readers can access a list of growth stocks with zero net debt 100% free, right now.
說到底,有時候更容易集中精力關注根本不需要債務的公司。讀者可以免費訪問零淨債務增長股票列表。
Have feedback on this article? Concerned about the content? Get in touch with us directly. Alternatively, email editorial-team (at) simplywallst.com.
This article by Simply Wall St is general in nature. We provide commentary based on historical data and analyst forecasts only using an unbiased methodology and our articles are not intended to be financial advice. It does not constitute a recommendation to buy or sell any stock, and does not take account of your objectives, or your financial situation. We aim to bring you long-term focused analysis driven by fundamental data. Note that our analysis may not factor in the latest price-sensitive company announcements or qualitative material. Simply Wall St has no position in any stocks mentioned.
對本文有任何反饋?對內容有任何疑慮?請直接與我們聯繫。或者,發送電子郵件至editorial-team@simplywallst.com。
這篇文章是Simply Wall St的一般性文章。我們根據歷史數據和分析師預測提供評論,只使用公正的方法論,我們的文章並不意味着提供任何金融建議。文章不構成買賣任何股票的建議,也不考慮您的目標或您的財務狀況。我們的目標是帶給您基本數據驅動的長期關注分析。請注意,我們的分析可能不考慮最新的價格敏感公司公告或定性材料。Simply Wall St沒有任何股票頭寸。
譯文內容由第三人軟體翻譯。
