
Investors in Fortive (NYSE:FTV) Have Seen Notable Returns of 38% Over the Past Five Years
Investors in Fortive (NYSE:FTV) Have Seen Notable Returns of 38% Over the Past Five Years
 During five years of share price growth, Fortive achieved compound earnings per share (EPS) growth of 3.4% per year. The EPS growth is more impressive than the yearly share price gain of 3% over the same period. So one could conclude that the broader market has become more cautious towards the stock.
 If you buy and hold a stock for many years, you'd hope to be making a profit. Furthermore, you'd generally like to see the share price rise faster than the market. But Fortive Corporation (NYSE:FTV) has fallen short of that second goal, with a share price rise of 13% over five years, which is below the market return. Zooming in, the stock is up a respectable 10% in the last year.
如果您買入並持有股票多年,您希望能賺取利潤。此外,您一般希望看到股價上漲速度快於市場。但Fortive Corporation (紐交所:FTV)並未達到第二個目標,股價在五年內上漲了13%,低於市場回報。具體來看,股價在過去一年裏上漲了可觀的10%。
So let's assess the underlying fundamentals over the last 5 years and see if they've moved in lock-step with shareholder returns.
因此,讓我們評估過去5年的基本面,看看它們是否和股東的回報率相符。
While markets are a powerful pricing mechanism, share prices reflect investor sentiment, not just underlying business performance. One way to examine how market sentiment has changed over time is to look at the interaction between a company's share price and its earnings per share (EPS).
儘管市場是一個強大的價格機制,但股票價格反映的不僅是潛在業務績效,還反映了投資者的情緒。 了解市場情緒隨時間的變化的一種方法是查看公司的股價與每股收益(EPS)之間的互動。
During five years of share price growth, Fortive achieved compound earnings per share (EPS) growth of 3.4% per year. The EPS growth is more impressive than the yearly share price gain of 3% over the same period. So one could conclude that the broader market has become more cautious towards the stock.
在股價增長的五年中,Fortive實現了每股收益(EPS)複合增長率爲每年3.4%。EPS增速比同期每年3%的股價漲幅更令人印象深刻。因此,人們可以得出結論,整個市場對該股變得更加謹慎。
You can see how EPS has changed over time in the image below (click on the chart to see the exact values).
您可以在下面的圖片中查看每股收益如何隨時間變化(單擊圖表以查看確切的價值)。
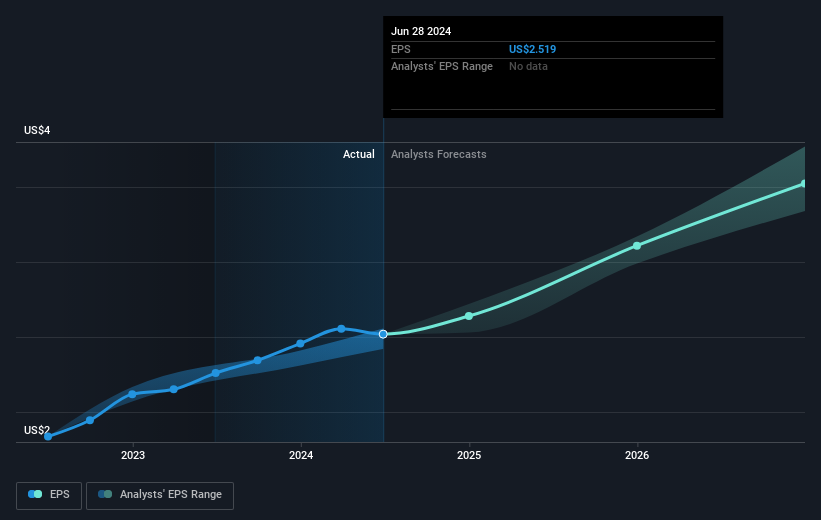
We know that Fortive has improved its bottom line lately, but is it going to grow revenue? This free report showing analyst revenue forecasts should help you figure out if the EPS growth can be sustained.
我們知道Fortive最近改善了底線,但它會增長營業收入嗎? 這份免費報告顯示分析師的營收預測,應該會幫助您判斷EPS增長是否可持續。
What About Dividends?
那麼分紅怎麼樣呢?
As well as measuring the share price return, investors should also consider the total shareholder return (TSR). The TSR incorporates the value of any spin-offs or discounted capital raisings, along with any dividends, based on the assumption that the dividends are reinvested. Arguably, the TSR gives a more comprehensive picture of the return generated by a stock. We note that for Fortive the TSR over the last 5 years was 38%, which is better than the share price return mentioned above. And there's no prize for guessing that the dividend payments largely explain the divergence!
除了衡量股價回報,投資者還應考慮總股東回報率 (TSR)。 TSR包括任何拆股或折價增資的價值,以及任何分紅派息,基於分紅被再投資的假設。可以說,TSR更全面地展現了股票帶來的回報。我們注意到,對於Fortive來說,過去5年的TSR爲38%,優於上述提到的股價回報。毫無疑問,分紅支付很大程度上解釋了這種分歧!
A Different Perspective
不同的觀點
Fortive shareholders are up 11% for the year (even including dividends). But that return falls short of the market. The silver lining is that the gain was actually better than the average annual return of 7% per year over five year. It is possible that returns will improve along with the business fundamentals. Before spending more time on Fortive it might be wise to click here to see if insiders have been buying or selling shares.
Fortive的股東今年漲幅爲11%(甚至包括分紅)。但這個回報未能達到市場水平。樂觀的一面是,收益實際上比過去五年的年均7%更好。隨着業務基本面的改善,回報可能會提高。在花費更多時間研究Fortive之前,點擊這裏查看內部人員是否一直在買入或賣出股票可能更明智。
For those who like to find winning investments this free list of undervalued companies with recent insider purchasing, could be just the ticket.
對於那些喜歡尋找獲勝投資的人來說,最近有內部購買的低估公司免費列表可能是一個很好的選擇。
Please note, the market returns quoted in this article reflect the market weighted average returns of stocks that currently trade on American exchanges.
請注意,本文所引述的市場回報反映了目前在美國交易所上市的股票的市場加權平均回報。
Have feedback on this article? Concerned about the content? Get in touch with us directly. Alternatively, email editorial-team (at) simplywallst.com.
This article by Simply Wall St is general in nature. We provide commentary based on historical data and analyst forecasts only using an unbiased methodology and our articles are not intended to be financial advice. It does not constitute a recommendation to buy or sell any stock, and does not take account of your objectives, or your financial situation. We aim to bring you long-term focused analysis driven by fundamental data. Note that our analysis may not factor in the latest price-sensitive company announcements or qualitative material. Simply Wall St has no position in any stocks mentioned.
對本文有任何反饋?對內容有任何疑慮?請直接與我們聯繫。或者,發送電子郵件至editorial-team@simplywallst.com。
這篇文章是Simply Wall St的一般性文章。我們根據歷史數據和分析師預測提供評論,只使用公正的方法論,我們的文章並不意味着提供任何金融建議。文章不構成買賣任何股票的建議,也不考慮您的目標或您的財務狀況。我們的目標是帶給您基本數據驅動的長期關注分析。請注意,我們的分析可能不考慮最新的價格敏感公司公告或定性材料。Simply Wall St沒有任何股票頭寸。
譯文內容由第三人軟體翻譯。
