
Simulations Plus' (NASDAQ:SLP) Earnings Trajectory Could Turn Positive as the Stock Grows 9.7% This Past Week
Simulations Plus' (NASDAQ:SLP) Earnings Trajectory Could Turn Positive as the Stock Grows 9.7% This Past Week
 Unhappily, Simulations Plus had to report a 6.3% decline in EPS over the last year. This reduction in EPS is not as bad as the 17% share price fall. This suggests the EPS fall has made some shareholders more nervous about the business. Having said that, the market is still optimistic, given the P/E ratio of 69.06.
 Passive investing in an index fund is a good way to ensure your own returns roughly match the overall market. But if you buy individual stocks, you can do both better or worse than that. For example, the Simulations Plus, Inc. (NASDAQ:SLP) share price is down 17% in the last year. That falls noticeably short of the market return of around 38%. However, the longer term returns haven't been so bad, with the stock down 12% in the last three years. The falls have accelerated recently, with the share price down 16% in the last three months.
Passive investing in an index fund is a good way to ensure your own returns roughly match the overall market. But if you buy individual stocks, you can do both better or worse than that. For example, the simulations plus, Inc.(納斯達克:SLP)股價在過去一年下跌了17%。 這明顯低於市場回報率約38%。 然而,長期回報表現並不那麼糟糕,該股在過去三年中下跌了12%。 最近股價下跌速度加快,過去三個月下跌了16%。
While the stock has risen 9.7% in the past week but long term shareholders are still in the red, let's see what the fundamentals can tell us.
儘管股票在過去一週上漲了9.7%,但長期股東仍處於虧損狀態,讓我們看看基本面能告訴我們些什麼。
To quote Buffett, 'Ships will sail around the world but the Flat Earth Society will flourish. There will continue to be wide discrepancies between price and value in the marketplace...' By comparing earnings per share (EPS) and share price changes over time, we can get a feel for how investor attitudes to a company have morphed over time.
引用巴菲特的話順便說一下,「船隻將環遊世界,但支持地球平面學會的人將大有可爲。 在市場上,價格和價值之間將繼續存在巨大的差異...」通過比較EPS和股價變化,我們可以了解到投資者對公司的態度隨時間的變化程度。
Unhappily, Simulations Plus had to report a 6.3% decline in EPS over the last year. This reduction in EPS is not as bad as the 17% share price fall. This suggests the EPS fall has made some shareholders more nervous about the business. Having said that, the market is still optimistic, given the P/E ratio of 69.06.
不幸的是,模擬加公司過去一年的每股收益下降了6.3%。 每股收益的降低並不像17%的股價下跌那麼糟糕。 這表明每股收益的下降讓一些股東對業務感到更緊張。 話雖如此,鑑於市盈率爲69.06,市場仍然很樂觀。
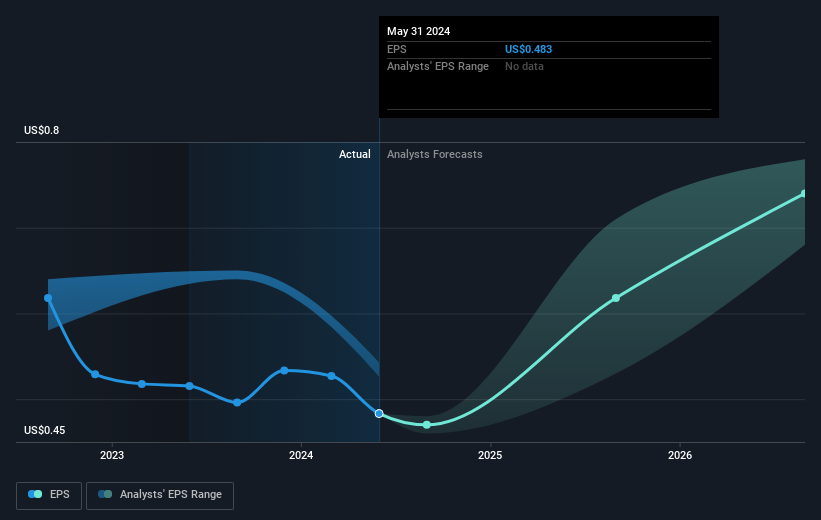
You can see below how EPS has changed over time (discover the exact values by clicking on the image).
下面可以看到每股收益隨時間的變化情況(通過點擊圖像來查看確切數值)。
Before buying or selling a stock, we always recommend a close examination of historic growth trends, available here.
在購買或出售股票之前,我們始終建議對歷史增長趨勢進行仔細研究,可以在這裏找到相關信息。
A Different Perspective
不同的觀點
While the broader market gained around 38% in the last year, Simulations Plus shareholders lost 16%. However, keep in mind that even the best stocks will sometimes underperform the market over a twelve month period. On the bright side, long term shareholders have made money, with a gain of 0.4% per year over half a decade. If the fundamental data continues to indicate long term sustainable growth, the current sell-off could be an opportunity worth considering. It's always interesting to track share price performance over the longer term. But to understand Simulations Plus better, we need to consider many other factors. Consider risks, for instance. Every company has them, and we've spotted 1 warning sign for Simulations Plus you should know about.
儘管更廣泛的市場在過去一年中增長了約38%,但simulations plus股東們卻損失了16%。 但是,請記住,即使是最好的股票有時也會在十二個月的時間裏跊表現市場。 在樂觀的一面,長期股東已經賺了錢,在過去的半個十年中,每年增長了0.4%。 如果基本數據繼續表明長期可持續增長,當前的拋售可能是值得考慮的機會。 跟蹤股價表現長期來看總是很有趣。但要更好地了解simulations plus,我們需要考慮許多其他因素。例如,考慮風險。每家公司都有風險,而我們已經發現了1個警告信號,你應該知道simulations plus。
Of course Simulations Plus may not be the best stock to buy. So you may wish to see this free collection of growth stocks.
當然,simulations plus可能不是最好的股票。所以,您可能希望查看這些免費的成長股集合。
Please note, the market returns quoted in this article reflect the market weighted average returns of stocks that currently trade on American exchanges.
請注意,本文所引述的市場回報反映了目前在美國交易所上市的股票的市場加權平均回報。
Have feedback on this article? Concerned about the content? Get in touch with us directly. Alternatively, email editorial-team (at) simplywallst.com.
This article by Simply Wall St is general in nature. We provide commentary based on historical data and analyst forecasts only using an unbiased methodology and our articles are not intended to be financial advice. It does not constitute a recommendation to buy or sell any stock, and does not take account of your objectives, or your financial situation. We aim to bring you long-term focused analysis driven by fundamental data. Note that our analysis may not factor in the latest price-sensitive company announcements or qualitative material. Simply Wall St has no position in any stocks mentioned.
對本文有任何反饋?對內容有任何疑慮?請直接與我們聯繫。或者,發送電子郵件至editorial-team@simplywallst.com。
這篇文章是Simply Wall St的一般性文章。我們根據歷史數據和分析師預測提供評論,只使用公正的方法論,我們的文章並不意味着提供任何金融建議。文章不構成買賣任何股票的建議,也不考慮您的目標或您的財務狀況。我們的目標是帶給您基本數據驅動的長期關注分析。請注意,我們的分析可能不考慮最新的價格敏感公司公告或定性材料。Simply Wall St沒有任何股票頭寸。
譯文內容由第三人軟體翻譯。
