
American Express Shows Bullish Signals Ahead Of Q3 Earnings, But Analysts Hold Back
American Express Shows Bullish Signals Ahead Of Q3 Earnings, But Analysts Hold Back
 American Express stock is exhibiting strong bullish momentum based on several technical indicators.
 American Express Co (NYSE:AXP) will be reporting its third-quarter earnings on Oct. 18. Wall Street expects $3.80 in earnings per share and $16.67 billion in revenues as the company reports before market hours.
美國運通公司(紐約證券交易所:AXP)將於10月18日公佈第三季度業績。華爾街預計每股盈利爲3.80美元,營收達167億美元,因公司在市場開盤前發佈業績。
The stock is up 84.29% over the past year, 51.1% year-to-date.
該股票過去一年上漲了84.29%,年初至今上漲了51.1%。
Let's look at what the charts indicate for American Express stock and how the stock currently maps against Wall Street estimates.
讓我們看看圖表對美國運通股票有何指示,以及該股目前如何與華爾街的預期相比。
American Express Stock Chart Is Bullish
美國運通股票走勢看好
American Express stock is exhibiting strong bullish momentum based on several technical indicators.
根據多項技術指標,美國運通股票目前表現出強勁的看好勢頭。
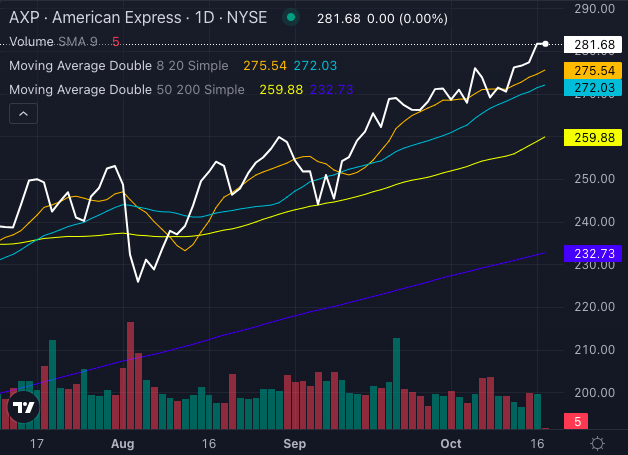
Chart created using Benzinga Pro
使用Benzinga Pro創建的圖表
The stock is currently trading at $281.68, which places it above key moving averages—its five-day, 20-day and 50-day exponential moving averages—indicating significant buying pressure.
該股目前交易價爲281.68美元,高於關鍵移動平均線,包括五日線、20日線和50日指數移動平均線,表明有顯著的購買壓力。
Specifically, American Express' stock price is above its eight-day SMA of $275.54 and 20-day SMA of $272.03 further confirms a bullish outlook, suggesting continued upward movement. The stock's 50-day SMA at $259.88 and its 200-day SMA at $232.73 are also well below the current price, reinforcing this positive trend.
具體而言,美國運通的股價高於其$275.54的八日簡單移動平均線和$272.03的二十日簡單移動平均線,進一步確認了看好的展望,暗示持續向上運動。該股的$259.88的五十日簡單移動平均線和$232.73的二百日簡單移動平均線也遠低於當前價格,強化了這一積極趨勢。
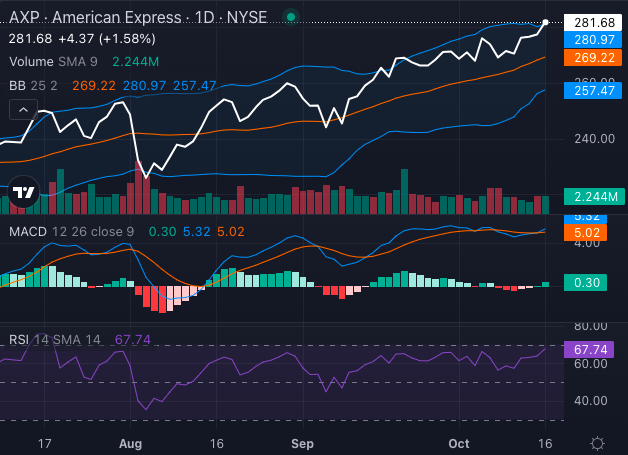
Chart created using Benzinga Pro
使用Benzinga Pro創建的圖表
Additionally, the MACD indicator is at 5.32, which signals further bullish potential for American Express stock. However, caution is warranted as the RSI stands at 67.74, and rising to approach the overbought territory. This could suggest a short-term pullback.
此外,MACD指標爲5.32,這表明美國運通股票有進一步看好的潛力。然而,需要謹慎,因爲RSI爲67.74,並升至接近超買區域。這可能暗示短期回調。
However, the Bollinger Bands also indicate that American Express stock remains in a bullish phase with the stock trading in then upper bullish band.
然而,布林帶也表明美國運通股票仍處於看好階段,股價交投於上行看漲通道中。
Investors should monitor these technical signals closely as the stock approaches a potential breakout.
投資者應密切監視這些技術信號,因爲股價接近潛在的突破點。
Read Also: Here's How Much $1000 Invested In American Express 15 Years Ago Would Be Worth Today
閱讀更多:15年前投資美國運通$1000現在會值多少錢
...But Analysts See 7% Downside
分析師看到7%的下行風險
Ratings & Consensus Estimates: The consensus analyst rating on American Express stock stands at a Neutral currently with a price target of $228.60. The latest analyst ratings for American Express stock were issued by Morgan Stanley, Monness, Crespi, Hardt, and Barclays in October. These analysts have set an average price target of $266, indicating an implied downside of 6.54% for the stock.
評級和共識預測:美國運通股票的共識分析師評級目前爲中立,目標價爲228.60美元。摩根士丹利、Monness、Crespi、Hardt和巴克萊銀行在十月發佈了美國運通股票的最新分析師評級。這些分析師設定了266美元的平均目標價,表明該股的暗含下跌幅度爲6.54%。
AXP Price Action: American Express stock was trading at $284.62 at the time of publication.
AXP股價走勢:美國運通股票在發佈時交易價格爲284.62美元。
- S&P 500, Dow Jones Hit New Record Highs As Financial Stocks Soar On Upbeat Earnings
- 標普500、道瓊斯創下新紀錄高點,金融股因盈利樂觀而飆升
Image: Shutterstock
圖片:shutterstock
譯文內容由第三人軟體翻譯。
