
Hello Group (NASDAQ:MOMO) Sheds US$152m, Company Earnings and Investor Returns Have Been Trending Downwards for Past Five Years
Hello Group (NASDAQ:MOMO) Sheds US$152m, Company Earnings and Investor Returns Have Been Trending Downwards for Past Five Years
 Looking back five years, both Hello Group's share price and EPS declined; the latter at a rate of 6.2% per year. This reduction in EPS is less than the 27% annual reduction in the share price. So it seems the market was too confident about the business, in the past. The low P/E ratio of 6.10 further reflects this reticence.
 Long term investing is the way to go, but that doesn't mean you should hold every stock forever. We don't wish catastrophic capital loss on anyone. Imagine if you held Hello Group Inc. (NASDAQ:MOMO) for half a decade as the share price tanked 80%. And the share price decline continued over the last week, dropping some 11%.
長期投資是一種明智的選擇,但這並不意味着你應該永遠持有每隻股票。我們不希望任何人遭受災難性的資本損失。想象一下,如果你在過去半個世紀一直持有摯文集團公司(納斯達克:MOMO)的股票,而股價下跌了80%。而股價在過去一週繼續下跌,跌幅達11%。
With the stock having lost 11% in the past week, it's worth taking a look at business performance and seeing if there's any red flags.
股票在過去一週已經下跌了11%,值得看一看業務表現,看看是否有任何警告信號。
While markets are a powerful pricing mechanism, share prices reflect investor sentiment, not just underlying business performance. One way to examine how market sentiment has changed over time is to look at the interaction between a company's share price and its earnings per share (EPS).
儘管市場是一個強大的價格機制,但股票價格反映的不僅是潛在業務績效,還反映了投資者的情緒。 了解市場情緒隨時間的變化的一種方法是查看公司的股價與每股收益(EPS)之間的互動。
Looking back five years, both Hello Group's share price and EPS declined; the latter at a rate of 6.2% per year. This reduction in EPS is less than the 27% annual reduction in the share price. So it seems the market was too confident about the business, in the past. The low P/E ratio of 6.10 further reflects this reticence.
回顧過去五年,摯文集團的股價和每股收益均下降;後者以每年6.2%的速度下降。每股收益的降低速度小於股價年度下跌27%的速度。因此,似乎市場對該業務的過去過於自信。市盈率低至6.10進一步反映出這種猶豫不決。
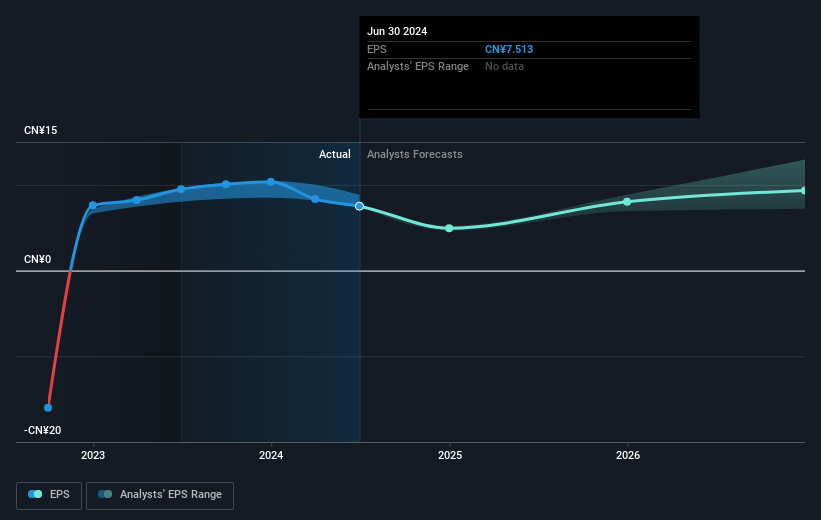
The graphic below depicts how EPS has changed over time (unveil the exact values by clicking on the image).
下圖顯示了EPS隨時間變化的情況(點擊圖像以顯示確切值)。
This free interactive report on Hello Group's earnings, revenue and cash flow is a great place to start, if you want to investigate the stock further.
摯文集團的免費互動報告涵蓋了收益、營業收入和現金流,是進一步研究該股票的絕佳起點。
What About Dividends?
那麼分紅怎麼樣呢?
As well as measuring the share price return, investors should also consider the total shareholder return (TSR). The TSR incorporates the value of any spin-offs or discounted capital raisings, along with any dividends, based on the assumption that the dividends are reinvested. It's fair to say that the TSR gives a more complete picture for stocks that pay a dividend. In the case of Hello Group, it has a TSR of -71% for the last 5 years. That exceeds its share price return that we previously mentioned. This is largely a result of its dividend payments!
除了衡量股價回報,投資者還應考慮總股東回報(TSR)。 TSR包括任何剝離或折價的資本籌資價值,以及根據股息再投資的假設確定的任何分紅。 可以說TSR爲支付股息的股票提供了更完整的圖片。 就摯文集團而言,過去5年其TSR爲-71%。 這超過了之前提到的股價回報。 這在很大程度上是其分紅支付的結果!
A Different Perspective
不同的觀點
Hello Group shareholders are up 3.6% for the year (even including dividends). But that was short of the market average. But at least that's still a gain! Over five years the TSR has been a reduction of 11% per year, over five years. It could well be that the business is stabilizing. While it is well worth considering the different impacts that market conditions can have on the share price, there are other factors that are even more important. Case in point: We've spotted 1 warning sign for Hello Group you should be aware of.
摯文集團股東今年收益率爲3.6%,包括分紅在內。 但這還不及市場平均水平。 但至少這仍然是一筆收益! 五年內,TSR每年減少11%。 業務可能正在穩定。 雖然值得考慮市場狀況對股價的影響,但還有其他更重要的因素。 例如:我們發現了摯文集團1個警示標誌,您應該注意。
For those who like to find winning investments this free list of undervalued companies with recent insider purchasing, could be just the ticket.
對於那些喜歡尋找獲勝投資的人來說,最近有內部購買的低估公司免費列表可能是一個很好的選擇。
Please note, the market returns quoted in this article reflect the market weighted average returns of stocks that currently trade on American exchanges.
請注意,本文所引述的市場回報反映了目前在美國交易所上市的股票的市場加權平均回報。
Have feedback on this article? Concerned about the content? Get in touch with us directly. Alternatively, email editorial-team (at) simplywallst.com.
This article by Simply Wall St is general in nature. We provide commentary based on historical data and analyst forecasts only using an unbiased methodology and our articles are not intended to be financial advice. It does not constitute a recommendation to buy or sell any stock, and does not take account of your objectives, or your financial situation. We aim to bring you long-term focused analysis driven by fundamental data. Note that our analysis may not factor in the latest price-sensitive company announcements or qualitative material. Simply Wall St has no position in any stocks mentioned.
對本文有任何反饋?對內容有任何疑慮?請直接與我們聯繫。或者,發送電子郵件至editorial-team@simplywallst.com。
這篇文章是Simply Wall St的一般性文章。我們根據歷史數據和分析師預測提供評論,只使用公正的方法論,我們的文章並不意味着提供任何金融建議。文章不構成買賣任何股票的建議,也不考慮您的目標或您的財務狀況。我們的目標是帶給您基本數據驅動的長期關注分析。請注意,我們的分析可能不考慮最新的價格敏感公司公告或定性材料。Simply Wall St沒有任何股票頭寸。
譯文內容由第三人軟體翻譯。
