
Universal Display Corporation's (NASDAQ:OLED) Fundamentals Look Pretty Strong: Could The Market Be Wrong About The Stock?
Universal Display Corporation's (NASDAQ:OLED) Fundamentals Look Pretty Strong: Could The Market Be Wrong About The Stock?
 Return on Equity = Net Profit (from continuing operations) ÷ Shareholders' Equity
 It is hard to get excited after looking at Universal Display's (NASDAQ:OLED) recent performance, when its stock has declined 13% over the past three months. But if you pay close attention, you might gather that its strong financials could mean that the stock could potentially see an increase in value in the long-term, given how markets usually reward companies with good financial health. In this article, we decided to focus on Universal Display's ROE.
看着universal display(NASDAQ:oled概念)最近的表現後很難感到興奮,因爲其股價在過去三個月下跌了13%。但是如果您仔細觀察,您可能會發現其強大的財務狀況可能意味着股票在長期內有增值的潛力,因爲市場通常會獎勵財務狀況良好的公司。在本文中,我們決定專注於universal display的roe。
ROE or return on equity is a useful tool to assess how effectively a company can generate returns on the investment it received from its shareholders. Simply put, it is used to assess the profitability of a company in relation to its equity capital.
roe或股東權益回報率是評估公司如何有效地從股東那裏獲得回報的有用工具。簡而言之,它用於評估公司相對於其權益資本的盈利能力。
How To Calculate Return On Equity?
如何計算股東權益報酬率?
The formula for return on equity is:
權益回報率的計算公式是:
Return on Equity = Net Profit (from continuing operations) ÷ Shareholders' Equity
淨資產收益率 = 淨利潤(從持續經營中獲得)÷ 股東權益
So, based on the above formula, the ROE for Universal Display is:
因此,根據上述公式,universal display的roe爲:
15% = US$223m ÷ US$1.5b (Based on the trailing twelve months to June 2024).
15% = 2.23億美元 ÷ 15億美元(截至2024年6月的過去十二個月數據)。
The 'return' is the profit over the last twelve months. That means that for every $1 worth of shareholders' equity, the company generated $0.15 in profit.
「回報」是過去十二個月的利潤。這意味着對於每1美元的股東權益,該公司的利潤爲0.15美元。
What Is The Relationship Between ROE And Earnings Growth?
ROE與盈利增長之間的關係是什麼?
Thus far, we have learned that ROE measures how efficiently a company is generating its profits. Depending on how much of these profits the company reinvests or "retains", and how effectively it does so, we are then able to assess a company's earnings growth potential. Assuming all else is equal, companies that have both a higher return on equity and higher profit retention are usually the ones that have a higher growth rate when compared to companies that don't have the same features.
到目前爲止,我們已經學到 ROE(淨資產收益率)可以衡量公司盈利的效率。具體取決於公司再投資或「保留」多少這些利潤,以及其有效程度,我們便能夠評估公司的盈利增長潛力。假設其他條件相同,ROE和利潤保留率都較高的公司通常比不具備這些特徵的公司增長率更高。
A Side By Side comparison of Universal Display's Earnings Growth And 15% ROE
universal display的收益增長與15%的roe的橫向比較
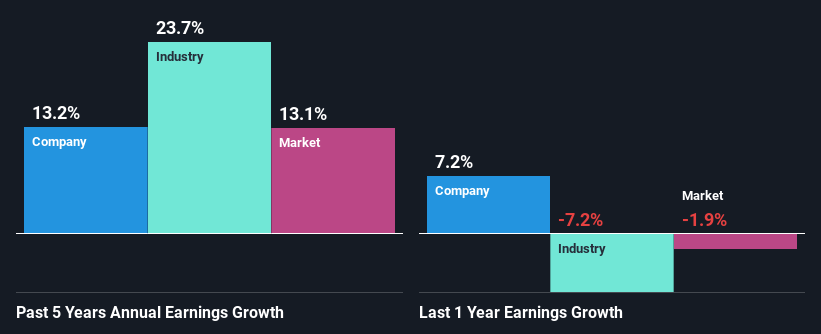
To begin with, Universal Display seems to have a respectable ROE. On comparing with the average industry ROE of 12% the company's ROE looks pretty remarkable. This certainly adds some context to Universal Display's decent 13% net income growth seen over the past five years.
首先,universal display似乎擁有可觀的roe。與行業平均roe 12%相比,公司的roe看起來相當出色。 過去五年來universal display 13%的淨利潤增長顯然爲此增添了一些背景。
Next, on comparing with the industry net income growth, we found that Universal Display's reported growth was lower than the industry growth of 24% over the last few years, which is not something we like to see.
接下來,與行業淨利潤增長相比,我們發現universal display的報告增長低於過去幾年的行業增長率24%,這並非我們希望看到的情況。
Earnings growth is an important metric to consider when valuing a stock. The investor should try to establish if the expected growth or decline in earnings, whichever the case may be, is priced in. By doing so, they will have an idea if the stock is headed into clear blue waters or if swampy waters await. If you're wondering about Universal Display's's valuation, check out this gauge of its price-to-earnings ratio, as compared to its industry.
盈利增長是評估股票價值時必須考慮的重要指標。投資者應該設法確定預期盈利增長或下降(無論哪種情況)是否已經計入價格。通過這樣做,他們會知道股票是朝着清澈的藍水前進,還是等着進入泥濘的水域。如果你想了解universal display的估值情況,請查看其市盈率與行業板塊的比較。
Is Universal Display Efficiently Re-investing Its Profits?
universal display是否高效地重新投資其利潤?
Universal Display has a healthy combination of a moderate three-year median payout ratio of 27% (or a retention ratio of 73%) and a respectable amount of growth in earnings as we saw above, meaning that the company has been making efficient use of its profits.
universal display具有健康的特徵,中等三年中位數股利支付比率爲27%(或留存比率爲73%),並且收益增長方面表現可觀,意味着該公司有效利用其利潤。
Moreover, Universal Display is determined to keep sharing its profits with shareholders which we infer from its long history of eight years of paying a dividend. Upon studying the latest analysts' consensus data, we found that the company is expected to keep paying out approximately 25% of its profits over the next three years.
此外,根據我們推斷的信息,universal display決心與股東分享利潤,這是由其長達八年的分紅歷史所證明的。在研究最新的分析師共識數據時,我們發現該公司預計未來三年將繼續支付約25%的利潤。
Summary
總的來說,我們對偉明環保的表現非常滿意。具體而言,我們喜歡公司以高回報率再投資了其利潤的很大一部分。當然,這導致公司的收益大幅增長。但是,最新的行業分析師預測表明,該公司的收益預計將加速增長。
In total, we are pretty happy with Universal Display's performance. Specifically, we like that the company is reinvesting a huge chunk of its profits at a high rate of return. This of course has caused the company to see a good amount of growth in its earnings. Having said that, looking at the current analyst estimates, we found that the company's earnings are expected to gain momentum. To know more about the latest analysts predictions for the company, check out this visualization of analyst forecasts for the company.
總的來說,我們對universal display的表現相當滿意。具體來說,我們喜歡這家公司以高回報率再投資其利潤的做法。當然,這導致該公司的收益有着相當大的增長。話雖如此,從當前分析師的估計來看,我們發現該公司的收益預計將勢頭增強。想了解更多關於該公司最新分析師預測的信息,請查看這個用於關於該公司的分析師預測的可視化。
Have feedback on this article? Concerned about the content? Get in touch with us directly. Alternatively, email editorial-team (at) simplywallst.com.
This article by Simply Wall St is general in nature. We provide commentary based on historical data and analyst forecasts only using an unbiased methodology and our articles are not intended to be financial advice. It does not constitute a recommendation to buy or sell any stock, and does not take account of your objectives, or your financial situation. We aim to bring you long-term focused analysis driven by fundamental data. Note that our analysis may not factor in the latest price-sensitive company announcements or qualitative material. Simply Wall St has no position in any stocks mentioned.
對本文有任何反饋?對內容有任何疑慮?請直接與我們聯繫。或者,發送電子郵件至editorial-team@simplywallst.com。
這篇文章是Simply Wall St的一般性文章。我們根據歷史數據和分析師預測提供評論,只使用公正的方法論,我們的文章並不意味着提供任何金融建議。文章不構成買賣任何股票的建議,也不考慮您的目標或您的財務狀況。我們的目標是帶給您基本數據驅動的長期關注分析。請注意,我們的分析可能不考慮最新的價格敏感公司公告或定性材料。Simply Wall St沒有任何股票頭寸。
譯文內容由第三人軟體翻譯。
