
We Like These Underlying Return On Capital Trends At Olin (NYSE:OLN)
We Like These Underlying Return On Capital Trends At Olin (NYSE:OLN)
 0.087 = US$543m ÷ (US$7.7b - US$1.4b)
 Finding a business that has the potential to grow substantially is not easy, but it is possible if we look at a few key financial metrics. Typically, we'll want to notice a trend of growing return on capital employed (ROCE) and alongside that, an expanding base of capital employed. Put simply, these types of businesses are compounding machines, meaning they are continually reinvesting their earnings at ever-higher rates of return. So on that note, Olin (NYSE:OLN) looks quite promising in regards to its trends of return on capital.
找到一個有潛力大幅增長的企業並不容易,但如果我們觀察一些關鍵的財務指標,是有可能的。通常情況下,我們會希望注意到資本使用效率(ROCE)不斷增長的趨勢,以及資本使用量逐漸擴大。簡單來說,這些類型的企業是複利機器,這意味着它們會以越來越高的回報率不斷再投資其收益。因此,從這個角度來看,歐林(紐交所:OLN)在回報率趨勢方面看起來相當有前景。
Return On Capital Employed (ROCE): What Is It?
資本僱用回報率(ROCE)是什麼?
For those who don't know, ROCE is a measure of a company's yearly pre-tax profit (its return), relative to the capital employed in the business. The formula for this calculation on Olin is:
對於那些不了解的人,ROCE是衡量公司每年稅前利潤(其回報)與企業資本使用的比例。Olin的計算公式爲:
Return on Capital Employed = Earnings Before Interest and Tax (EBIT) ÷ (Total Assets - Current Liabilities)
資產僱用回報率(ROCE)是指企業利潤,即企業稅前利潤除以企業投入的總資本(負債加股權)。如果ROCE高於企業財務成本的承受能力,那麼企業就會創造出更多的價值。
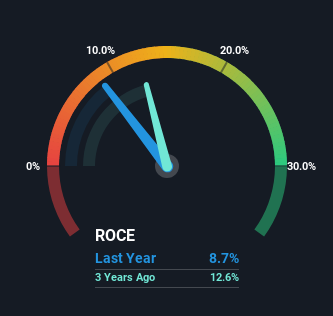
0.087 = US$543m ÷ (US$7.7b - US$1.4b) (Based on the trailing twelve months to June 2024).
0.087 = 54300萬美元 ÷ ( 7700000000美元 - 14億美元)(基於截至2024年6月的過去十二個月)。
Thus, Olin has an ROCE of 8.7%. On its own that's a low return on capital but it's in line with the industry's average returns of 8.7%.
因此,歐林的ROCE爲8.7%。單獨的話,這是一個較低的資本回報率,但與行業平均回報率8.7%一致。
In the above chart we have measured Olin's prior ROCE against its prior performance, but the future is arguably more important. If you're interested, you can view the analysts predictions in our free analyst report for Olin .
在上圖中,我們已經測量了歐林先前的ROCE與其先前的表現,但未來可謂更爲重要。如果您感興趣,您可以查看我們爲歐林免費提供的分析師報告中的分析師預測。
What The Trend Of ROCE Can Tell Us
儘管如此,當我們看 enphase energy (納斯達克股票代碼:ENPH) 的時候,它似乎並沒有完全符合這些要求。
Olin has not disappointed in regards to ROCE growth. The figures show that over the last five years, returns on capital have grown by 46%. That's not bad because this tells for every dollar invested (capital employed), the company is increasing the amount earned from that dollar. Speaking of capital employed, the company is actually utilizing 24% less than it was five years ago, which can be indicative of a business that's improving its efficiency. If this trend continues, the business might be getting more efficient but it's shrinking in terms of total assets.
歐林在ROCE增長方面表現不錯。數據顯示,在過去的五年裏,資本回報率增長了46%。這並不差,因爲這意味着對每一美元的投資(資本使用)而言,公司從這一美元中獲得的收益正在增加。說到資本使用,公司實際上比五年前少使用了24%,這可能表明業務正在提高效率。如果這種趨勢持續下去,公司可能變得更有效率,但在總資產方面卻在縮減。
The Bottom Line On Olin's ROCE
關於歐林的ROCE總結
In summary, it's great to see that Olin has been able to turn things around and earn higher returns on lower amounts of capital. And a remarkable 196% total return over the last five years tells us that investors are expecting more good things to come in the future. So given the stock has proven it has promising trends, it's worth researching the company further to see if these trends are likely to persist.
總的來說,看到歐林能夠扭轉局面,以較低的資本額獲得更高的回報是令人高興的。在過去的五年裏,總回報率達到了驚人的196%,這告訴我們投資者對未來期待更多好消息。因此,考慮到股票已經證明具有有希望的趨勢,值得進一步研究該公司,以了解這些趨勢是否可能持續。
If you'd like to know about the risks facing Olin, we've discovered 2 warning signs that you should be aware of.
如果您想了解歐林面臨的風險,我們已經發現了兩個警示信號,您應該注意。
While Olin may not currently earn the highest returns, we've compiled a list of companies that currently earn more than 25% return on equity. Check out this free list here.
雖然歐林目前的回報率可能不是最高的,但我們編制了一份目前的股本回報率超過25%的公司名單。 在此處查看此免費清單。
Have feedback on this article? Concerned about the content? Get in touch with us directly. Alternatively, email editorial-team (at) simplywallst.com.
This article by Simply Wall St is general in nature. We provide commentary based on historical data and analyst forecasts only using an unbiased methodology and our articles are not intended to be financial advice. It does not constitute a recommendation to buy or sell any stock, and does not take account of your objectives, or your financial situation. We aim to bring you long-term focused analysis driven by fundamental data. Note that our analysis may not factor in the latest price-sensitive company announcements or qualitative material. Simply Wall St has no position in any stocks mentioned.
對本文有任何反饋?對內容有任何疑慮?請直接與我們聯繫。或者,發送電子郵件至editorial-team@simplywallst.com。
這篇文章是Simply Wall St的一般性文章。我們根據歷史數據和分析師預測提供評論,只使用公正的方法論,我們的文章並不意味着提供任何金融建議。文章不構成買賣任何股票的建議,也不考慮您的目標或您的財務狀況。我們的目標是帶給您基本數據驅動的長期關注分析。請注意,我們的分析可能不考慮最新的價格敏感公司公告或定性材料。Simply Wall St沒有任何股票頭寸。
譯文內容由第三人軟體翻譯。
