
Globant's (NYSE:GLOB) Five-year Earnings Growth Trails the 16% YoY Shareholder Returns
Globant's (NYSE:GLOB) Five-year Earnings Growth Trails the 16% YoY Shareholder Returns
 During five years of share price growth, Globant achieved compound earnings per share (EPS) growth of 22% per year. The EPS growth is more impressive than the yearly share price gain of 16% over the same period. Therefore, it seems the market has become relatively pessimistic about the company. Of course, with a P/E ratio of 54.08, the market remains optimistic.
 The worst result, after buying shares in a company (assuming no leverage), would be if you lose all the money you put in. But when you pick a company that is really flourishing, you can make more than 100%. For example, the Globant S.A. (NYSE:GLOB) share price has soared 111% in the last half decade. Most would be very happy with that. It's also good to see the share price up 11% over the last quarter.
購買股票後的最糟糕結果(假設沒有槓桿)就是如果你虧掉了你投入的所有錢。但是當你選擇一家真正蓬勃發展的公司時,你可以獲得超過100%的回報。例如,Globant S.A.(紐交所:GLOB)股價在過去的半個十年飆升了111%。大多數人對此會感到非常高興。看到股價在上個季度上漲11%也是一個好兆頭。
On the back of a solid 7-day performance, let's check what role the company's fundamentals have played in driving long term shareholder returns.
在穩定的七天表現之後,讓我們看看公司的基本面對長期股東回報的影響。
In his essay The Superinvestors of Graham-and-Doddsville Warren Buffett described how share prices do not always rationally reflect the value of a business. One imperfect but simple way to consider how the market perception of a company has shifted is to compare the change in the earnings per share (EPS) with the share price movement.
禾倫·巴菲特在他的文章《格雷厄姆與多德維爾的超級投資者》中描述了股票價格並不總是合理地反映了一家企業的價值。考慮市場對一家公司的看法如何轉變的一種不完美但簡單的方法,是將每股收益(EPS)的變化與股價的動態進行比較。
During five years of share price growth, Globant achieved compound earnings per share (EPS) growth of 22% per year. The EPS growth is more impressive than the yearly share price gain of 16% over the same period. Therefore, it seems the market has become relatively pessimistic about the company. Of course, with a P/E ratio of 54.08, the market remains optimistic.
在五年的股價增長中,Globant實現了每年22%的複合每股收益(EPS)增長。EPS增長比同一時期每年16%的股價增長更令人印象深刻。因此,市場似乎對這家公司變得相對悲觀。當然,以54.08的市盈率來看,市場仍然持樂觀態度。
You can see below how EPS has changed over time (discover the exact values by clicking on the image).
下面可以看到每股收益隨時間的變化情況(通過點擊圖像來查看確切數值)。
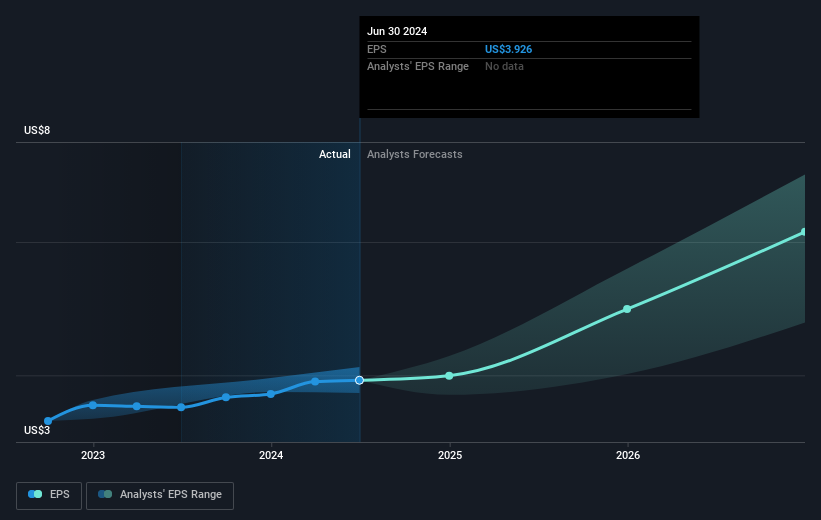
We know that Globant has improved its bottom line lately, but is it going to grow revenue? Check if analysts think Globant will grow revenue in the future.
我們知道Globant最近改善了其底線,但它的營業收入是否會增長呢?請查看分析師是否認爲Globant未來會增長營業收入。
A Different Perspective
不同的觀點
Globant shareholders are up 8.0% for the year. But that return falls short of the market. On the bright side, the longer term returns (running at about 16% a year, over half a decade) look better. It may well be that this is a business worth popping on the watching, given the continuing positive reception, over time, from the market. I find it very interesting to look at share price over the long term as a proxy for business performance. But to truly gain insight, we need to consider other information, too. Take risks, for example - Globant has 1 warning sign we think you should be aware of.
Globant的股東今年漲幅爲8.0%。但這一回報落後於市場。但值得一提的是,長期回報率(每年約16%,持續半個世紀以上)看起來更好。考慮到市場長期以來對其持續的積極反響,這可能是一個值得關注的業務,隨着時間的推移。我發現長期觀察股價是業務表現的一個替代指標非常有趣。但要真正獲得洞察力,我們也需要考慮其他信息。比如說風險 - globant有1個警告標誌,我們認爲您應該知道。
We will like Globant better if we see some big insider buys. While we wait, check out this free list of undervalued stocks (mostly small caps) with considerable, recent, insider buying.
如果我們看到一些內部大宗買入交易,我們會更喜歡Globant。在等待的時候,查看這份免費的大宗交易股票名單(主要是小市值股票),其中包括相當多的近期內部買入交易。
Please note, the market returns quoted in this article reflect the market weighted average returns of stocks that currently trade on American exchanges.
請注意,本文所引述的市場回報反映了目前在美國交易所上市的股票的市場加權平均回報。
Have feedback on this article? Concerned about the content? Get in touch with us directly. Alternatively, email editorial-team (at) simplywallst.com.
This article by Simply Wall St is general in nature. We provide commentary based on historical data and analyst forecasts only using an unbiased methodology and our articles are not intended to be financial advice. It does not constitute a recommendation to buy or sell any stock, and does not take account of your objectives, or your financial situation. We aim to bring you long-term focused analysis driven by fundamental data. Note that our analysis may not factor in the latest price-sensitive company announcements or qualitative material. Simply Wall St has no position in any stocks mentioned.
對本文有任何反饋?對內容有任何疑慮?請直接與我們聯繫。或者,發送電子郵件至editorial-team@simplywallst.com。
這篇文章是Simply Wall St的一般性文章。我們根據歷史數據和分析師預測提供評論,只使用公正的方法論,我們的文章並不意味着提供任何金融建議。文章不構成買賣任何股票的建議,也不考慮您的目標或您的財務狀況。我們的目標是帶給您基本數據驅動的長期關注分析。請注意,我們的分析可能不考慮最新的價格敏感公司公告或定性材料。Simply Wall St沒有任何股票頭寸。
譯文內容由第三人軟體翻譯。
