
I3 Verticals, Inc. (NASDAQ:IIIV): When Will It Breakeven?
I3 Verticals, Inc. (NASDAQ:IIIV): When Will It Breakeven?
 Before we wrap up, there's one issue worth mentioning. i3 Verticals currently has a debt-to-equity ratio of 108%. Typically, debt shouldn't exceed 40% of your equity, which in this case, the company has significantly overshot. Note that a higher debt obligation increases the risk around investing in the loss-making company.
 We feel now is a pretty good time to analyse i3 Verticals, Inc.'s (NASDAQ:IIIV) business as it appears the company may be on the cusp of a considerable accomplishment. i3 Verticals, Inc. provides integrated payment and software solutions primarily to the public sector and healthcare markets in the United States. The US$778m market-cap company posted a loss in its most recent financial year of US$811k and a latest trailing-twelve-month loss of US$629k shrinking the gap between loss and breakeven. As path to profitability is the topic on i3 Verticals' investors mind, we've decided to gauge market sentiment. Below we will provide a high-level summary of the industry analysts' expectations for the company.
我們認爲現在是分析i3 verticals, Inc.(納斯達克:IIIV)業務的一個相當好的時機,因爲公司似乎正處在取得重大成就的邊緣。 i3 verticals,Inc.主要爲美國的公共部門和醫療保健市場提供集成支付和軟件解決方案。這家市值7.78億美元的公司在最近一個財政年度虧損81.1萬美元,並在最新的滾動十二個月中虧損62.9萬美元,縮小了虧損與盈虧平衡之間的差距。由於盈利路徑是i3 verticals的投資者關注的話題,我們決定衡量市場情緒。下面我們將簡要總結行業分析師對該公司的預期。
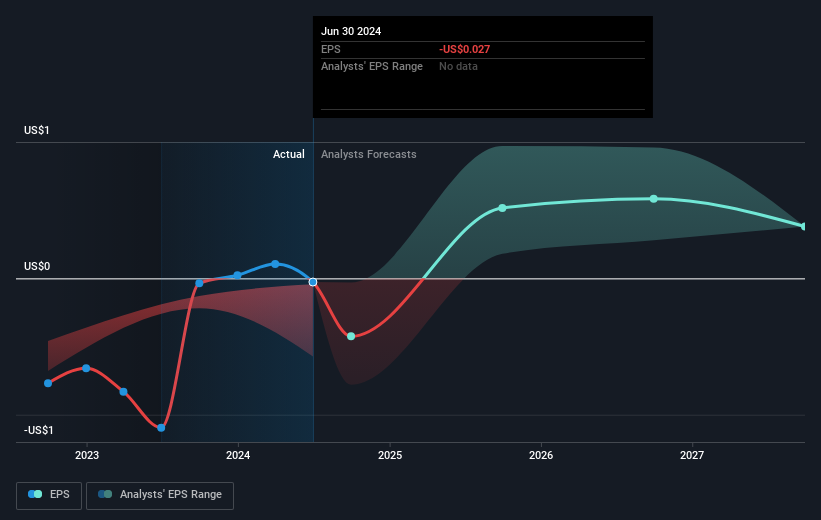
According to the 7 industry analysts covering i3 Verticals, the consensus is that breakeven is near. They anticipate the company to incur a final loss in 2024, before generating positive profits of US$14m in 2025. So, the company is predicted to breakeven just over a year from today. What rate will the company have to grow year-on-year in order to breakeven on this date? Using a line of best fit, we calculated an average annual growth rate of 75%, which is extremely buoyant. Should the business grow at a slower rate, it will become profitable at a later date than expected.
根據覆蓋i3 verticals的7位行業分析師的共識,盈虧平衡即將實現。他們預計公司將在2024年產生最終損失,然後在2025年創造1400萬美元的正利潤。因此,預計該公司將在今天的一年多一點實現盈虧平衡。爲了在這個日期實現盈虧平衡,公司每年需要增長多少百分比?使用最佳擬合線,我們計算出了平均年增長率爲75%,這是非常樂觀的。如果企業增長速度較慢,將會在預期之後的日期實現盈利。
We're not going to go through company-specific developments for i3 Verticals given that this is a high-level summary, but, take into account that typically a high forecast growth rate is not unusual for a company that is currently undergoing an investment period.
鑑於這只是一個高層次的摘要,我們不打算詳細研究i3 verticals的公司特定發展,但請注意,對於目前處於投資期的公司來說,高預測增長率並不罕見。
Before we wrap up, there's one issue worth mentioning. i3 Verticals currently has a debt-to-equity ratio of 108%. Typically, debt shouldn't exceed 40% of your equity, which in this case, the company has significantly overshot. Note that a higher debt obligation increases the risk around investing in the loss-making company.
在我們結束前,有一個值得一提的問題。i3 verticals目前的資產負債比爲108%。通常,負債不應超過您的權益的40%,在這種情況下,公司明顯超額。請注意,更高的債務義務增加了投資於虧損公司的風險。
Next Steps:
下一步:
There are too many aspects of i3 Verticals to cover in one brief article, but the key fundamentals for the company can all be found in one place – i3 Verticals' company page on Simply Wall St. We've also compiled a list of important aspects you should further examine:
在這篇簡短的文章中涉及i3 verticals的方面太多,但公司的關鍵基本面都可以在一個地方找到 - Simply Wall St上的i3 verticals公司頁面。我們還編制了一個您應進一步檢查的重要方面清單。
- Historical Track Record: What has i3 Verticals' performance been like over the past? Go into more detail in the past track record analysis and take a look at the free visual representations of our analysis for more clarity.
- Management Team: An experienced management team on the helm increases our confidence in the business – take a look at who sits on i3 Verticals' board and the CEO's background.
- Other High-Performing Stocks: Are there other stocks that provide better prospects with proven track records? Explore our free list of these great stocks here.
- 歷史數據:i3 verticals 過去的表現如何?在過去的記錄分析中進一步查看,並查看我們的分析免費可視化表達,以獲得更清晰的分析。
- 管理團隊:一個經驗豐富的管理團隊掌舵增加了我們對業務的信懇智能 - 查看誰在 i3 verticals 的董事會上以及 CEO 的背景。
- 其他高表現的股票:是否有其他表現更好的股票並具有經過驗證的歷史記錄?查看這裏的免費列表。
Have feedback on this article? Concerned about the content? Get in touch with us directly. Alternatively, email editorial-team (at) simplywallst.com.
This article by Simply Wall St is general in nature. We provide commentary based on historical data and analyst forecasts only using an unbiased methodology and our articles are not intended to be financial advice. It does not constitute a recommendation to buy or sell any stock, and does not take account of your objectives, or your financial situation. We aim to bring you long-term focused analysis driven by fundamental data. Note that our analysis may not factor in the latest price-sensitive company announcements or qualitative material. Simply Wall St has no position in any stocks mentioned.
對本文有任何反饋?對內容有任何疑慮?請直接與我們聯繫。或者,發送電子郵件至editorial-team@simplywallst.com。
這篇文章是Simply Wall St的一般性文章。我們根據歷史數據和分析師預測提供評論,只使用公正的方法論,我們的文章並不意味着提供任何金融建議。文章不構成買賣任何股票的建議,也不考慮您的目標或您的財務狀況。我們的目標是帶給您基本數據驅動的長期關注分析。請注意,我們的分析可能不考慮最新的價格敏感公司公告或定性材料。Simply Wall St沒有任何股票頭寸。
譯文內容由第三人軟體翻譯。
