
Phillips 66 (NYSE:PSX) Has More To Do To Multiply In Value Going Forward
Phillips 66 (NYSE:PSX) Has More To Do To Multiply In Value Going Forward
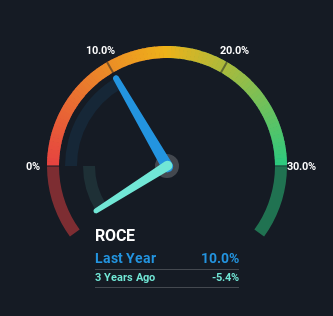
 0.10 = US$5.8b ÷ (US$76b - US$18b)
 What trends should we look for it we want to identify stocks that can multiply in value over the long term? Typically, we'll want to notice a trend of growing return on capital employed (ROCE) and alongside that, an expanding base of capital employed. Basically this means that a company has profitable initiatives that it can continue to reinvest in, which is a trait of a compounding machine. Although, when we looked at Phillips 66 (NYSE:PSX), it didn't seem to tick all of these boxes.
如果我們想要識別長期內能夠價值倍增的股票,我們應該關注哪些趨勢?通常情況下,我們會希望注意到資本利用率(ROCE)不斷增長的趨勢,以及資本利用率基礎擴大的趨勢。基本上,這意味着公司有盈利的創舉,可以繼續進行再投資,這是一個複利機器的特性。然而當我們看了Phillips 66(紐交所:PSX)時,並沒有看到所有這些方面都符合。
Understanding Return On Capital Employed (ROCE)
上面您可以看到蒙托克可再生能源現行ROCE與之前資本回報的比較,但過去只能知道這麼多。如果您感興趣,可以查看我們免費的蒙托克可再生能源分析師報告,了解分析師的預測。
If you haven't worked with ROCE before, it measures the 'return' (pre-tax profit) a company generates from capital employed in its business. To calculate this metric for Phillips 66, this is the formula:
如果您以前沒有使用過ROCE,它衡量公司從業務中使用資本所產生的「回報」(稅前利潤)。要爲Phillips 66計算這個指標,這是公式:
Return on Capital Employed = Earnings Before Interest and Tax (EBIT) ÷ (Total Assets - Current Liabilities)
資產僱用回報率(ROCE)是指企業利潤,即企業稅前利潤除以企業投入的總資本(負債加股權)。如果ROCE高於企業財務成本的承受能力,那麼企業就會創造出更多的價值。
0.10 = US$5.8b ÷ (US$76b - US$18b) (Based on the trailing twelve months to June 2024).
0.10 = US$58億 ÷ (US$760億 - US$18b)(基於截至2024年6月的過去十二個月)。
So, Phillips 66 has an ROCE of 10.0%. On its own, that's a low figure but it's around the 12% average generated by the Oil and Gas industry.
所以,Phillips 66的ROCE爲10.0%。單獨看這個數字很低,但它接近石油和燃料幣行業平均12%的水平。
In the above chart we have measured Phillips 66's prior ROCE against its prior performance, but the future is arguably more important. If you'd like, you can check out the forecasts from the analysts covering Phillips 66 for free.
在上面的圖表中,我們已經測量了phillips 66之前的ROCE與其之前的表現,但未來可能更爲重要。如果您願意,可以免費查看覆蓋phillips 66的分析師的預測。
So How Is Phillips 66's ROCE Trending?
那麼,phillips 66的ROCE趨勢如何?
In terms of Phillips 66's historical ROCE trend, it doesn't exactly demand attention. Over the past five years, ROCE has remained relatively flat at around 10.0% and the business has deployed 24% more capital into its operations. Given the company has increased the amount of capital employed, it appears the investments that have been made simply don't provide a high return on capital.
就phillips 66的歷史ROCE趨勢而言,它並沒有特別引起注意。在過去的五年中,ROCE基本保持在約10.0%,業務投入運營的資本增加了24%。鑑於公司增加了投入的資本數量,看起來所做的投資並沒有提供高回報率。
The Key Takeaway
重要提示
In conclusion, Phillips 66 has been investing more capital into the business, but returns on that capital haven't increased. Although the market must be expecting these trends to improve because the stock has gained 61% over the last five years. But if the trajectory of these underlying trends continue, we think the likelihood of it being a multi-bagger from here isn't high.
總之,phillips 66一直在向業務投入更多資本,但該資本的回報率並未增加。儘管市場可能預期這些趨勢會改善,因爲過去五年該股票上漲了61%。但如果這些潛在趨勢繼續,我們認爲從這裏成倍增長的可能性不高。
Phillips 66 does have some risks though, and we've spotted 2 warning signs for Phillips 66 that you might be interested in.
儘管phillips 66確實存在一些風險,我們發現了2個可能令您感興趣的phillips 66警示信號。
For those who like to invest in solid companies, check out this free list of companies with solid balance sheets and high returns on equity.
Hao Tian International Construction Investment Group確實存在一些風險,我們已經發現了一條警示標誌,你可能會感興趣。對於那些喜歡投資於實力雄厚的公司的人,可以查看這個由財務狀況強大、股本回報率高的公司組成的免費列表。
Have feedback on this article? Concerned about the content? Get in touch with us directly. Alternatively, email editorial-team (at) simplywallst.com.
This article by Simply Wall St is general in nature. We provide commentary based on historical data and analyst forecasts only using an unbiased methodology and our articles are not intended to be financial advice. It does not constitute a recommendation to buy or sell any stock, and does not take account of your objectives, or your financial situation. We aim to bring you long-term focused analysis driven by fundamental data. Note that our analysis may not factor in the latest price-sensitive company announcements or qualitative material. Simply Wall St has no position in any stocks mentioned.
對本文有任何反饋?對內容有任何疑慮?請直接與我們聯繫。或者,發送電子郵件至editorial-team@simplywallst.com。
這篇文章是Simply Wall St的一般性文章。我們根據歷史數據和分析師預測提供評論,只使用公正的方法論,我們的文章並不意味着提供任何金融建議。文章不構成買賣任何股票的建議,也不考慮您的目標或您的財務狀況。我們的目標是帶給您基本數據驅動的長期關注分析。請注意,我們的分析可能不考慮最新的價格敏感公司公告或定性材料。Simply Wall St沒有任何股票頭寸。
譯文內容由第三人軟體翻譯。