
Investors in Radian Group (NYSE:RDN) Have Seen Decent Returns of 77% Over the Past Five Years
Investors in Radian Group (NYSE:RDN) Have Seen Decent Returns of 77% Over the Past Five Years
 During five years of share price growth, Radian Group achieved compound earnings per share (EPS) growth of 6.6% per year. This EPS growth is slower than the share price growth of 9% per year, over the same period. So it's fair to assume the market has a higher opinion of the business than it did five years ago. That's not necessarily surprising considering the five-year track record of earnings growth.
 When you buy and hold a stock for the long term, you definitely want it to provide a positive return. Furthermore, you'd generally like to see the share price rise faster than the market. But Radian Group Inc. (NYSE:RDN) has fallen short of that second goal, with a share price rise of 52% over five years, which is below the market return. However, more recent buyers should be happy with the increase of 38% over the last year.
當您爲了長揸股票而購買時,您肯定希望它能提供正面收益。此外,您通常希望看到股價比市場上漲更快。但Radian Group Inc.(紐交所:RDN)未能實現第二個目標,其股價在五年內上漲了52%,低於市場回報。然而,近期更多的買家應該對過去一年中上漲38%感到滿意。
With that in mind, it's worth seeing if the company's underlying fundamentals have been the driver of long term performance, or if there are some discrepancies.
鑑於此,值得看看該公司的基本面是否一直是長期業績的驅動因素,或者是否存在一些不一致之處。
In his essay The Superinvestors of Graham-and-Doddsville Warren Buffett described how share prices do not always rationally reflect the value of a business. One way to examine how market sentiment has changed over time is to look at the interaction between a company's share price and its earnings per share (EPS).
在他的《格雷厄姆和道德斯維爾的超級投資者》一文中,禾倫·巴菲特描述了股價並不總是合理反映企業價值的方法。檢驗市場情緒如何隨時間變化的一種方法是觀察公司股價和每股收益(EPS)之間的互動關係。
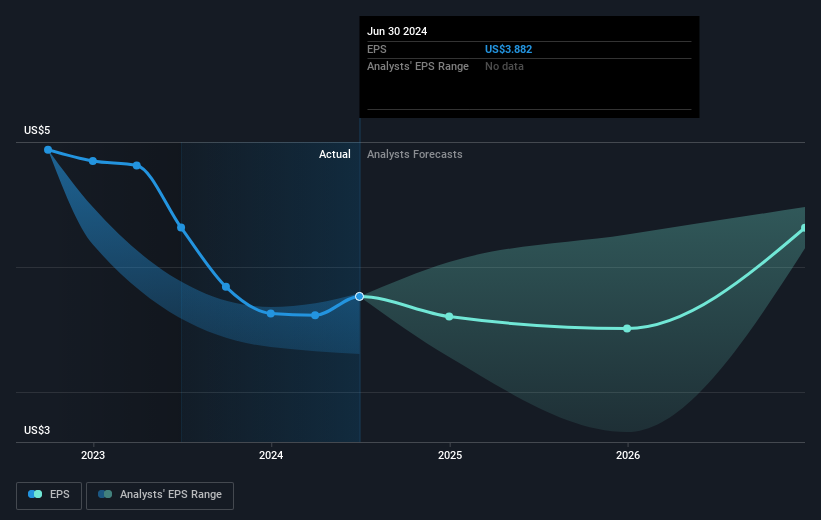
During five years of share price growth, Radian Group achieved compound earnings per share (EPS) growth of 6.6% per year. This EPS growth is slower than the share price growth of 9% per year, over the same period. So it's fair to assume the market has a higher opinion of the business than it did five years ago. That's not necessarily surprising considering the five-year track record of earnings growth.
在五年的股價增長期間,Radian Group的每股收益(EPS)複合增長率達到了每年6.6%。這一EPS增長速度比同期每年9%的股價增長率要慢。因此,可以認爲市場對該公司的看法比五年前更高。考慮到五年的盈利增長記錄,這並不奇怪。
You can see how EPS has changed over time in the image below (click on the chart to see the exact values).
您可以在下面的圖片中查看每股收益如何隨時間變化(單擊圖表以查看確切的價值)。
Dive deeper into Radian Group's key metrics by checking this interactive graph of Radian Group's earnings, revenue and cash flow.
通過查看Radian Group收益、營業收入和現金流的互動圖表,深入了解Radian Group的關鍵指標。
What About Dividends?
那麼分紅怎麼樣呢?
It is important to consider the total shareholder return, as well as the share price return, for any given stock. The TSR incorporates the value of any spin-offs or discounted capital raisings, along with any dividends, based on the assumption that the dividends are reinvested. So for companies that pay a generous dividend, the TSR is often a lot higher than the share price return. As it happens, Radian Group's TSR for the last 5 years was 77%, which exceeds the share price return mentioned earlier. And there's no prize for guessing that the dividend payments largely explain the divergence!
對於任何給定的股票,考慮總股東回報和股價回報是很重要的。TSR包括任何拆股或折價增資的價值,以及基於假設分紅被再投資的任何股息。因此,對於支付豐厚股息的公司,TSR往往比股價回報高得多。事實上,Radian Group過去5年的TSR爲77%,超過前面提到的股價回報。毫不奇怪,股息支付在很大程度上解釋了這種分歧!
A Different Perspective
不同的觀點
We're pleased to report that Radian Group shareholders have received a total shareholder return of 42% over one year. That's including the dividend. Since the one-year TSR is better than the five-year TSR (the latter coming in at 12% per year), it would seem that the stock's performance has improved in recent times. Someone with an optimistic perspective could view the recent improvement in TSR as indicating that the business itself is getting better with time. I find it very interesting to look at share price over the long term as a proxy for business performance. But to truly gain insight, we need to consider other information, too. To that end, you should learn about the 2 warning signs we've spotted with Radian Group (including 1 which is potentially serious) .
我們很高興地宣佈,Radian Group股東在過去一年獲得了42%的總股東回報。這已包括股息。由於一年的TSR優於五年的TSR(後者爲每年12%),似乎該股的表現近期有所改善。持樂觀態度的人可能會認爲TSR的最近改善表明業務本身隨着時間的推移正變得更好。我覺得長期內觀察股票價格作爲業務表現的一種代理很有趣。但要真正獲得洞察,我們還需要考慮其他信息。爲此,您應該了解我們發現的Radian Group 2個警示標誌(其中1個可能很嚴重)。
If you are like me, then you will not want to miss this free list of undervalued small caps that insiders are buying.
如果您像我一樣,就不會希望錯過這份免費的內部人士正在購買的低估小市值股票列表。
Please note, the market returns quoted in this article reflect the market weighted average returns of stocks that currently trade on American exchanges.
請注意,本文所引述的市場回報反映了目前在美國交易所上市的股票的市場加權平均回報。
Have feedback on this article? Concerned about the content? Get in touch with us directly. Alternatively, email editorial-team (at) simplywallst.com.
This article by Simply Wall St is general in nature. We provide commentary based on historical data and analyst forecasts only using an unbiased methodology and our articles are not intended to be financial advice. It does not constitute a recommendation to buy or sell any stock, and does not take account of your objectives, or your financial situation. We aim to bring you long-term focused analysis driven by fundamental data. Note that our analysis may not factor in the latest price-sensitive company announcements or qualitative material. Simply Wall St has no position in any stocks mentioned.
對本文有任何反饋?對內容有任何疑慮?請直接與我們聯繫。或者,發送電子郵件至editorial-team@simplywallst.com。
這篇文章是Simply Wall St的一般性文章。我們根據歷史數據和分析師預測提供評論,只使用公正的方法論,我們的文章並不意味着提供任何金融建議。文章不構成買賣任何股票的建議,也不考慮您的目標或您的財務狀況。我們的目標是帶給您基本數據驅動的長期關注分析。請注意,我們的分析可能不考慮最新的價格敏感公司公告或定性材料。Simply Wall St沒有任何股票頭寸。
譯文內容由第三人軟體翻譯。
